Bicycle and Pedestrian Infrastructure
As part of the Regional Active Transportation Network to support Complete Streets principles, the Bicycle and Pedestrian Infrastructure of the TSMP focuses on advancing Vision Zero goals through safer street designs and improved mobility options. Enhancing bicycle and pedestrian networks involves creating infrastructure that is accessible, safe, and comfortable for users of all ages and abilities. This section has been included to monitor current conditions and assess future needs to ensure the continued effectiveness and sustainability of these facilities.
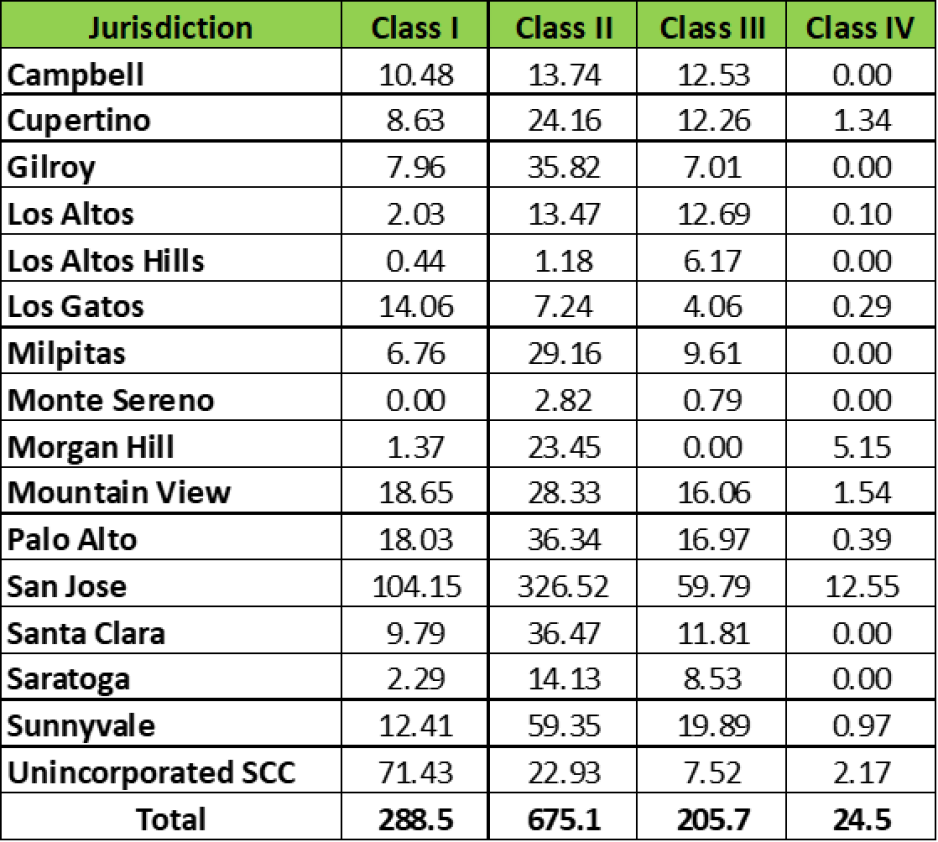
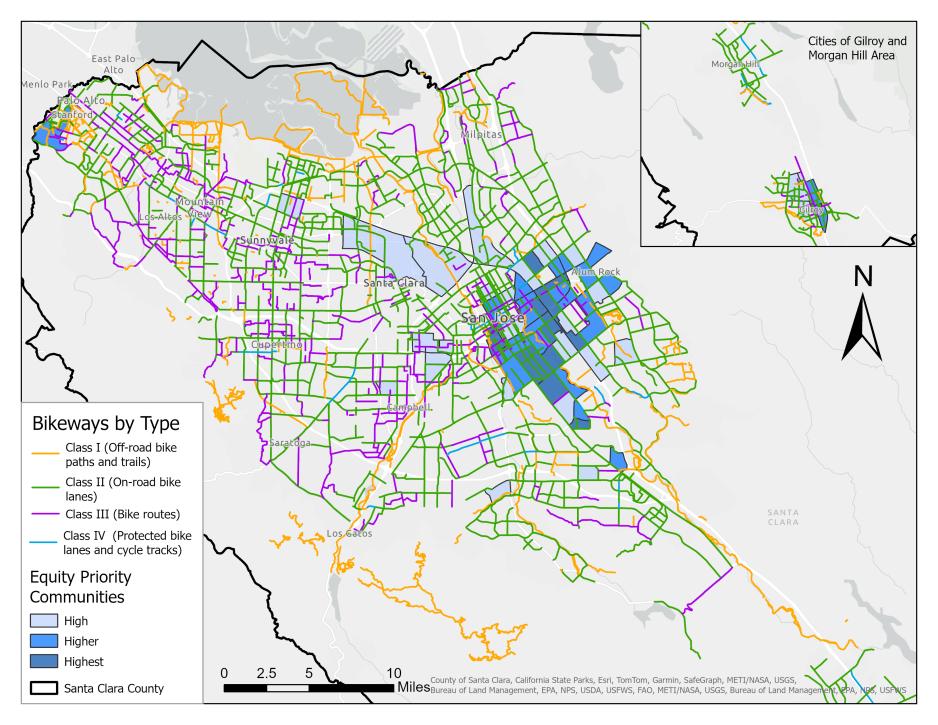
The following descriptions summarize the most recent available data for Santa Clara County’s jurisdictions by bikeway classification. There are four types of bikeway facilities:
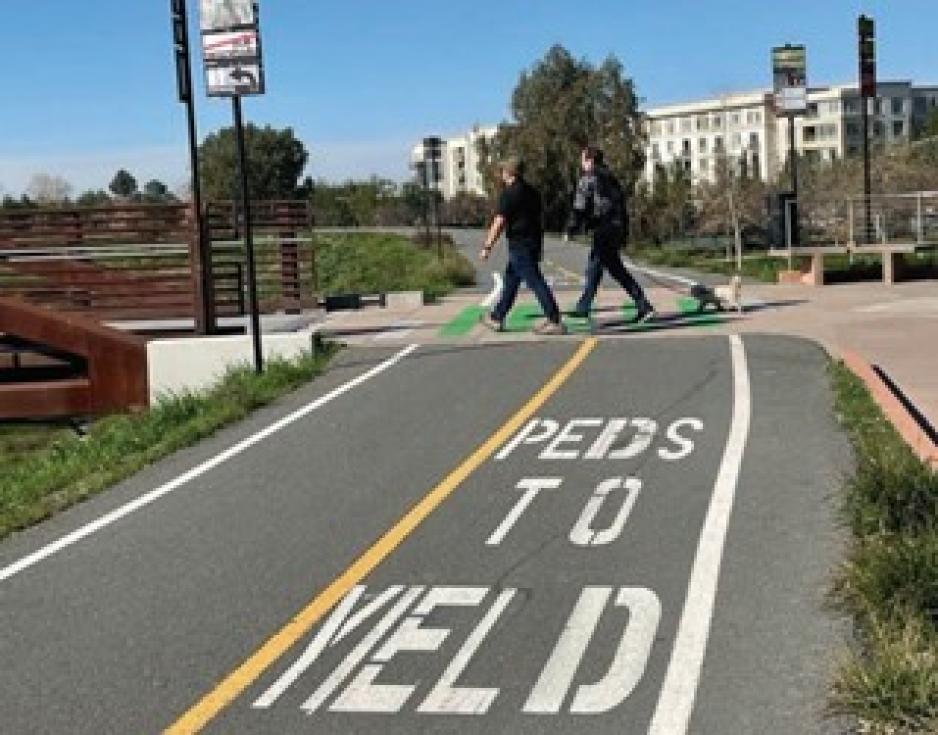
Class I – Bike Path
Exclusive paths for bicyclists and pedestrians, separated from vehicle traffic.
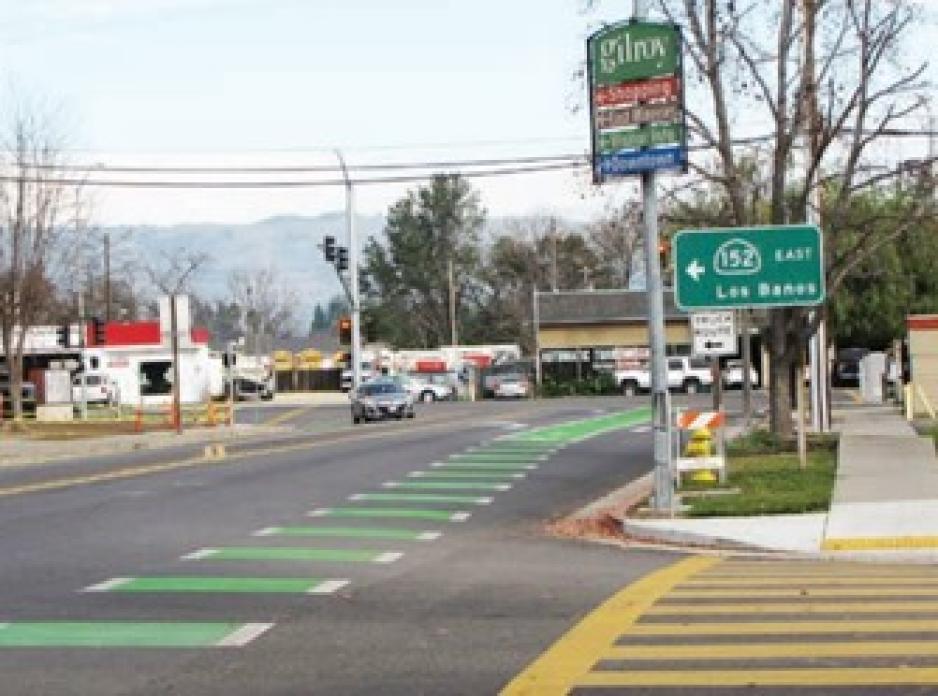
Class II – Bike Lane
Established along streets defined by special pavement striping and/or colored lanes for bicyclists.
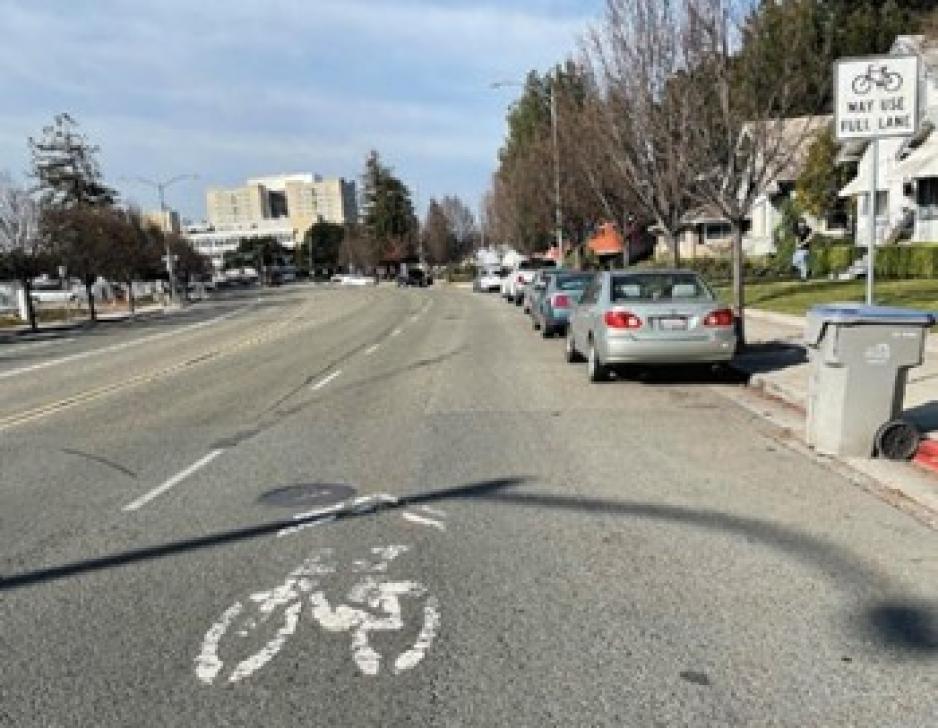
Class III – Bike Route
Preferred route for bicyclists on streets shared with motor vehicles.
Class IV – Separated Bikeways/Cycle Tracks
Bicycle facilities that are separated from traffic by parked cars, safe-hit posts, transit islands, or other physical barriers.
Table 1. 2023 Bikeway Mileage by Jurisdiction
Figure 1. 2023 Bikeway Map of Santa Clara County by Type
Pedestrian and Bicycle Involved Collisions
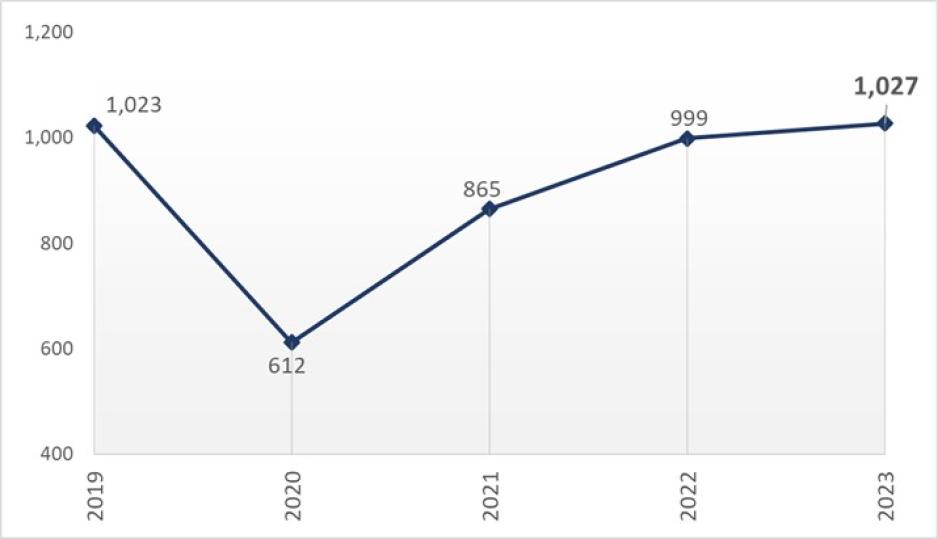
In 2023, there were 1,027 collisions involving bicyclists and pedestrians out of a total of 15,103 reported collisions in Santa Clara County. This represents approximately 7% of the total collisions in the County. The number of bicycle and pedestrian collisions increased by 28 or nearly 3% in 2023 compared to 2022 data:
* +28 (+3%) Total Collisions
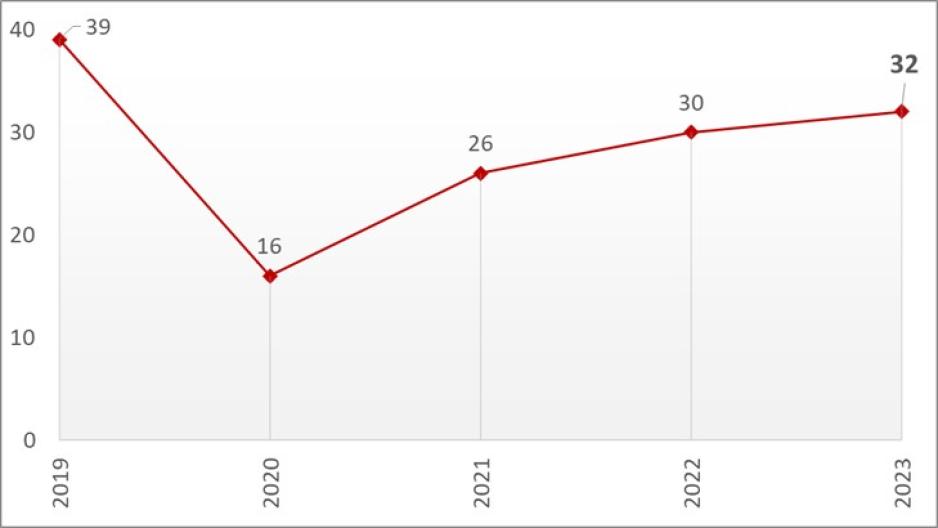
* +2 (+7%) Fatal Collisions
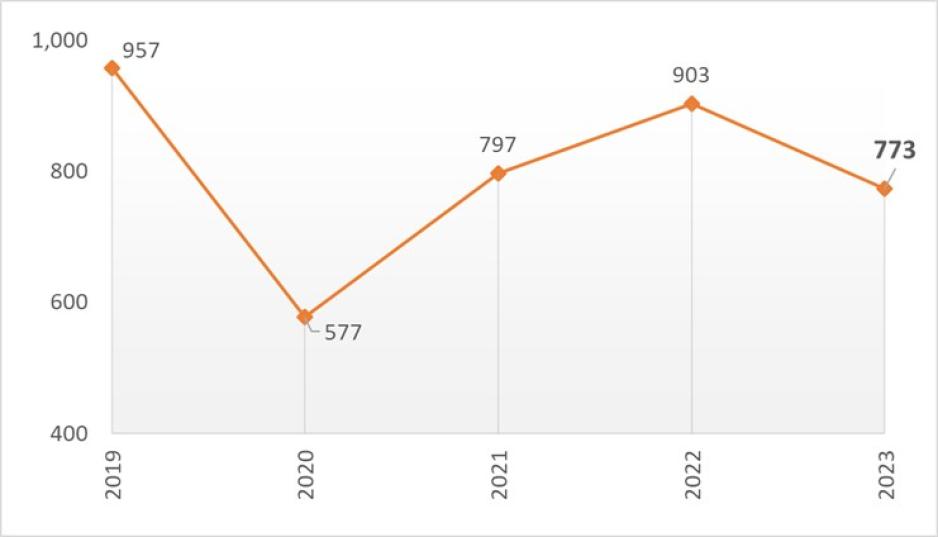
* -130 (-14%) Injury Collisions
The following graphs show the historical Fatal, Injury, and Total bicycle and pedestrian involved collision trends from 2019 to 2023.
Figure 2. Historical Injury Bike/Ped Collisions in Santa Clara County
Figure 3. Historical Fatal Bike/Ped Collisions in Santa Clara County
Figure 4. Historical Total Bike/Ped Collisions in Santa Clara County
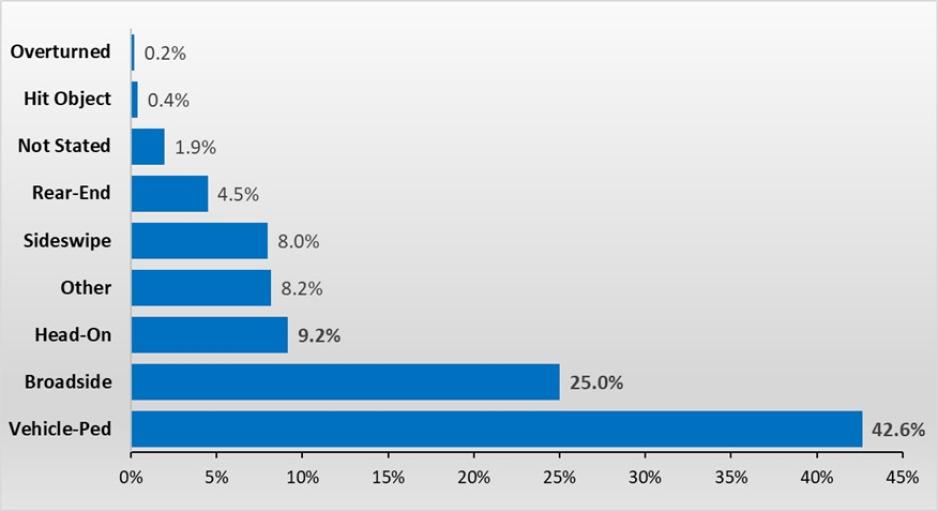
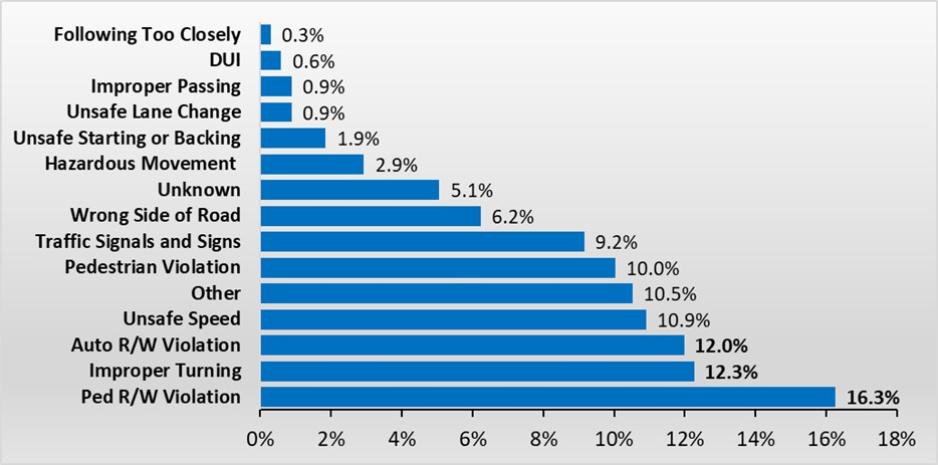
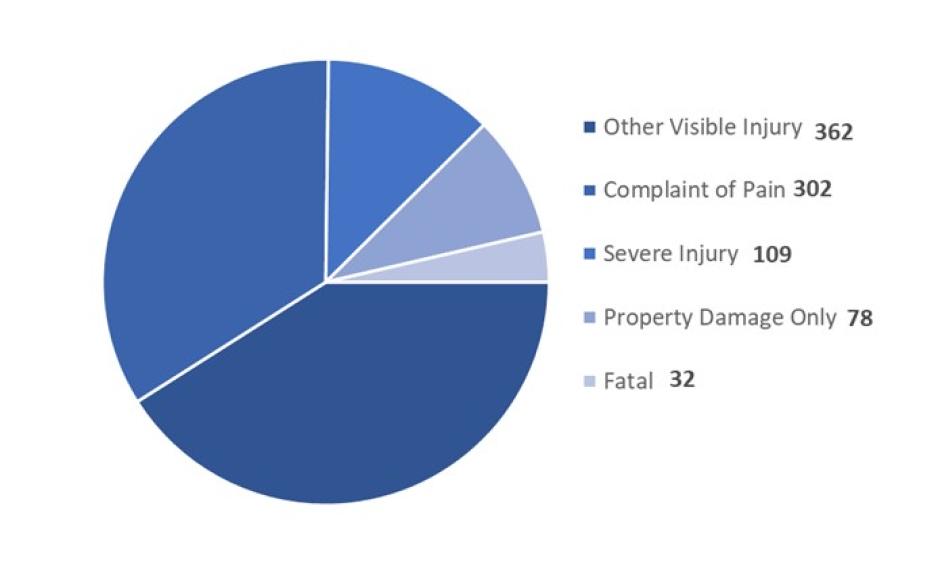
The following graphs show the percentages of bicycle and pedestrian involved collisions by type and primary factors or causes.
Figure 5. 2023 Bike/Ped Collision – Collision Types
Figure 6. 2023 Bike/Ped Collision – Primary Collision Factors (PCF)
Figure 7. 2023 Bike/Ped Collision – Degree of Injury
Frequent Collision Locations Involving Bicyclists and Pedestrians
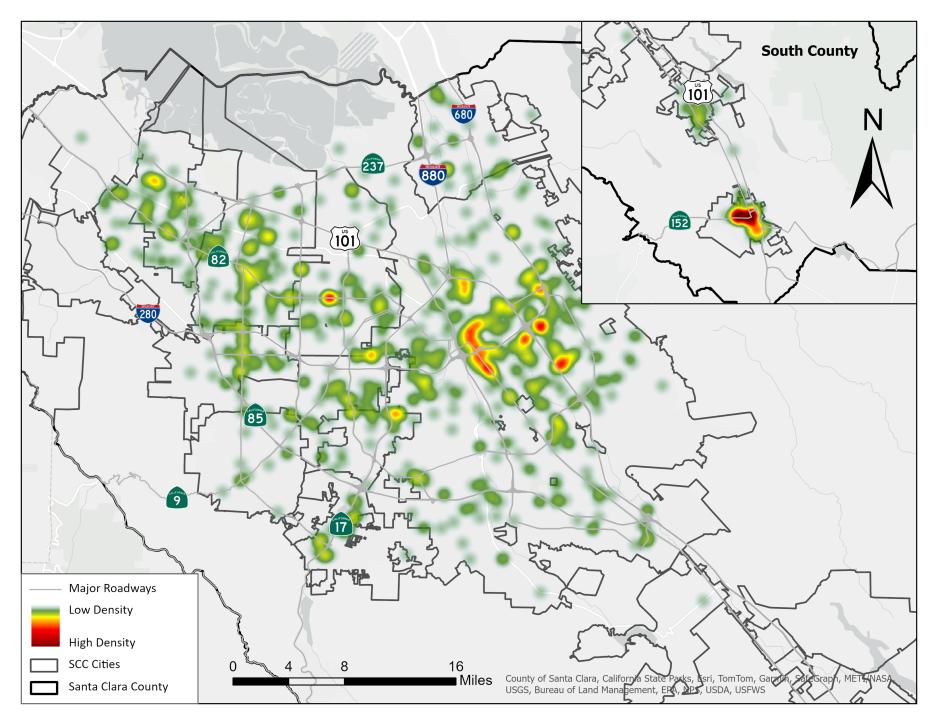
Monitoring and tracking locations of collisions year over year is a good performance metric for evaluating the effectiveness of collision reduction projects and strategies. The hotspot map below shows the location of bicycles and pedestrian collisions in 2023.
Figure 8. 2023 Bike and Pedestrian Collisions “Hot Spot” Map, Santa Clara County
Acronym
DUI: Driving Under the Influence
PCF: Primary Collision Factor
TSMP: Transportation Systems Monitoring Program
Sources
Data for this section was obtained from VTA’s member agencies and the countywide Crossroads Collision Database.
