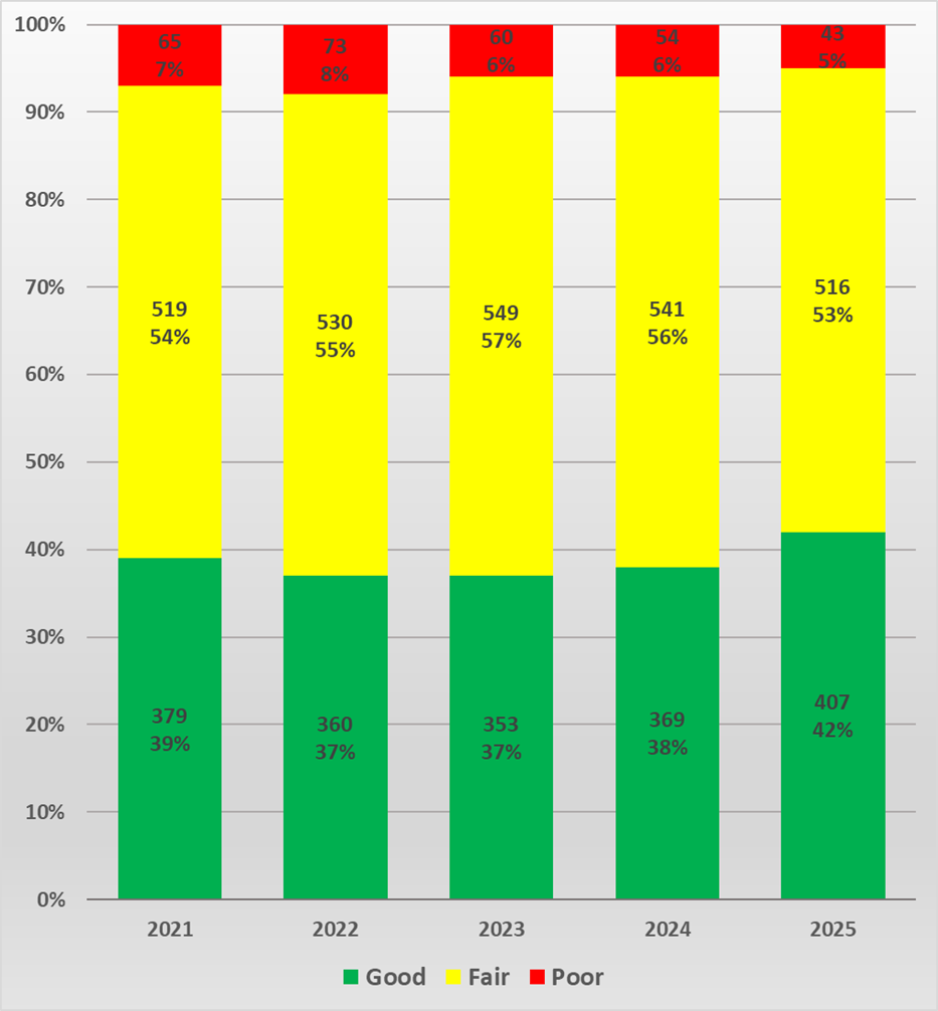
Bridges/Overcrossings Conditions
|
Roadside Assets
|
Indicators |
Previous Period |
Current Period |
Trend (Yearly) |
|
|---|---|---|---|---|
|
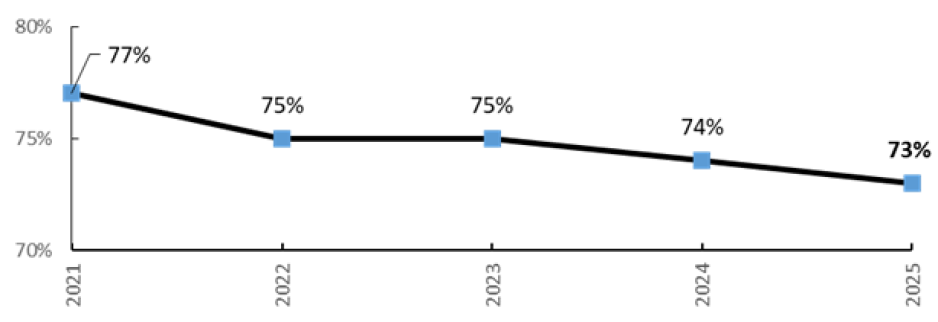
Traffic Signal Equipment (percentage of Assets in useful condition) |
74% (2024) |
73% (2025) |
|
|
|
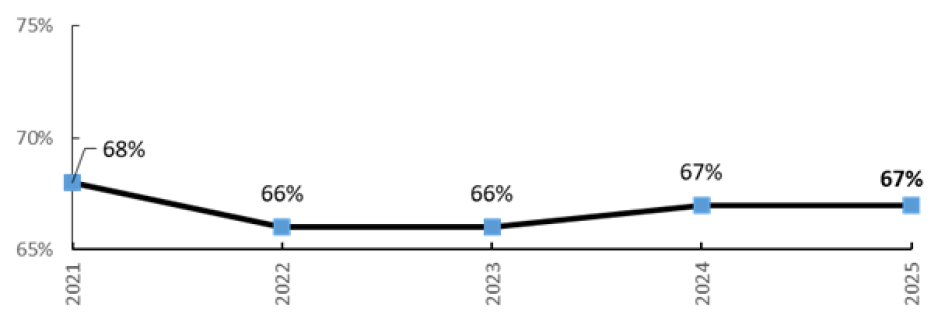
Pavement Markings (percentage of Assets in useful condition)' |
67% (2024) |
67% (2025) |
|
|
|
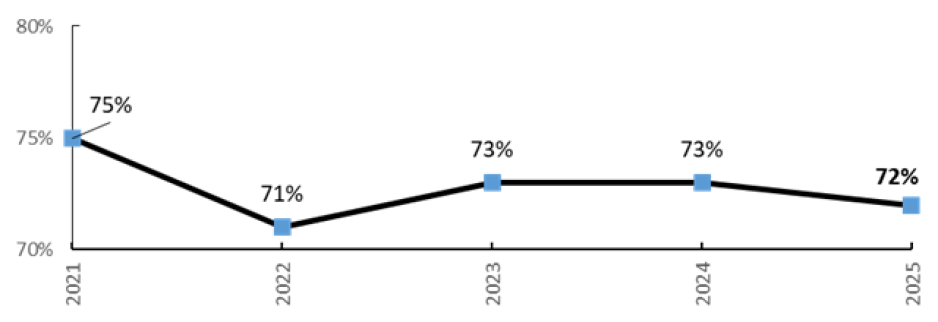
Traffic Signs (percentage of Assets in useful condition) |
73% (2024) |
72% (2025) |
|
|
|
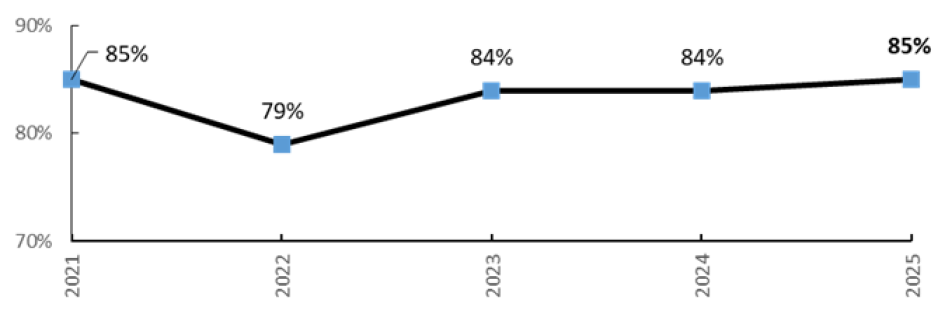
Roadside Litter and Graffiti Management (percent of roadside with virtually no or some litter and graffiti) |
84% (2024) |
85% (2025) |
|
|
Transit
|
Indicators |
Previous Period |
Current Period |
Trend (Yearly) |
|---|---|---|---|
|
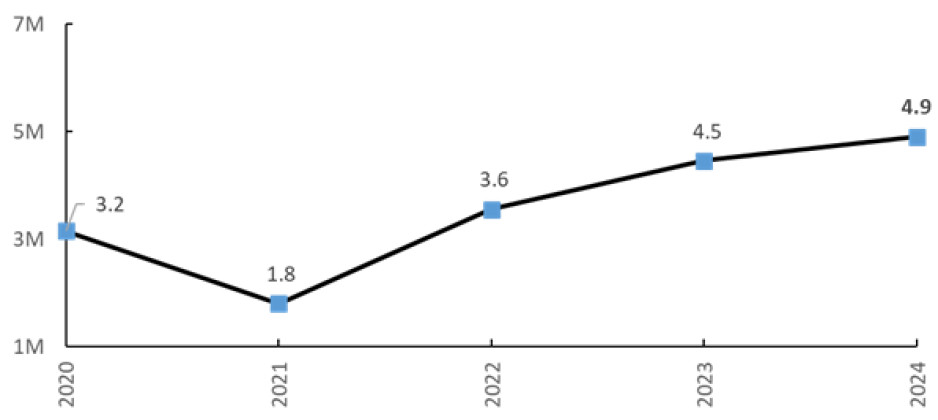
Light Rail Annual Ridership (in millions) |
4.5 (2023) |
4.9 (2024) |
|
|
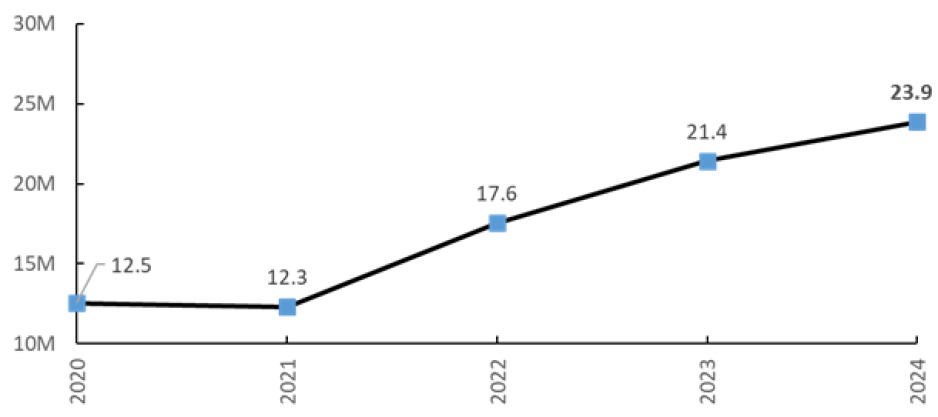
Bus Annual Ridership (in millions) |
21.4 (2023) |
23.9 (2024) |
|
Inventory Assets
|
Assets |
Quantity |
Year Collected |
|---|---|---|
|
Local Roadway Lane Miles Maintained (Total) |
9,748 miles |
2024 |
|
Local Roadway Lane Miles Repaired/Repaved (Total) |
2,135 miles |
2024 |
|
Miles Repaired/Repaved 2021 |
696 miles |
2024 |
|
Miles Repaired/Repaved 2022 |
689 miles |
2024 |
|
Miles Repaired/Repaved 2023 |
749 miles |
2024 |
|
Bus |
|
|
|
Fleet Age (avg.) |
11.9 Years |
2024 |
|
Fleet Size |
431 |
2024 |
|
Route Mileage |
1,265 miles |
2024 |
|
Routes |
61 |
2024 |
|
Stops |
3,188 |
2024 |
|
Light Rail |
|
|
|
Fleet Size |
98 |
2024 |
|
Miles of Track |
81.6 miles |
2024 |
|
Route Mileage |
42.2 miles |
2024 |
|
Stations |
59 |
2024 |
|
Highway – Ramp Meter Signals |
265 Operational 12 Non-operational 62 Planned 26 Part construction |
2021 |
|
Traffic Signal Controllers |
1,964 Local 145 State |
2024 |
|
Traffic Signs |
209,984 |
2024 |
Sources:
Bridges
The conditions of Santa Clara County bridges and overcrossings were retrieved from the Federal Highway Administration National Bridge Inventory (NBI) website at National Bridge Inventory - Management and Preservation - Bridges & Structures - Federal Highway Administration (dot.gov). The raw data was aggregated and summarized by “good”, “fair”, and “poor” condition indicators.
Roadside Assets
The data was obtained from responses to the 2025 Roadside Assets Condition Self-Assessment Surveys completed by VTA’s member agency local jurisdictions.
Transit
Statistics on transit ridership were obtained from American Public Transportation Association (APTA) Fourth Quarter 2024 Report for Santa Clara Valley Transportation Authority.
Inventory of Assets
Roadway Lane Miles Maintained and Repaired/Repaved
The data was obtained from responses to the 2025 Roadside Assets Condition Self-Assessment Surveys completed by VTA’s member agency local jurisdictions.
Bus
The data for VTA’s bus fleet was obtained from an internal document, “VTA Facts, Current Bus System Data, 2025” produced by VTA’s Transit Operations Analysis and Reporting Department. The bus fleet includes all the following bus types: 30 foot (38), 40 ft hybrid (264), 40 ft standard (24), artic 60 foot (75), express (40), and electric (0). Bus route mileage is reported as the total round trip.
Light Rail
The data for VTA’s light rail fleet was obtained from an internal document, “VTA Facts, Current Bus System Data, 2025” produced by VTA’s Transit Operations Analysis and Reporting Department. In addition to the fleet of 98 standard vehicles, there are also 4 historic trollies that operate during the Christmas holiday season. Route miles define the extent of the operational network and represent the total extent of routes available for trains to operate. Track miles take into account multiple track routes (e.g. for each route mile where there is double track, there are two track miles; where there are four tracks, there are four track miles).
Highway – Ramp Meter Signals
Data provided by Caltrans District 4 Office of Traffic Systems staff.
Traffic Signal Controllers
Data provided by Caltrans District 4 Office of Traffic Systems staff and responses to the 2025 Roadside Assets Condition Self-Assessment Surveys completed by VTA’s member agency local jurisdictions.
Traffic Signs
The data was obtained from responses to the 2025 Roadside Assets Condition Self-Assessment Surveys completed by VTA’s member agency local jurisdictions.
Bridges/Overcrossings Conditions
|
|
Roadside Assets
|
Indicators |
Previous Period |
Current Period |
Trend (Yearly) |
|
|---|---|---|---|---|
|
Traffic Signal Equipment (percentage of Assets in useful condition) |
74% (2024) |
73% (2025) |
|
|
|
Pavement Markings (percentage of Assets in useful condition)' |
67% (2024) |
67% (2025) |
|
|
|
Traffic Signs (percentage of Assets in useful condition) |
73% (2024) |
72% (2025) |
|
|
|
Roadside Litter and Graffiti Management (percent of roadside with virtually no or some litter and graffiti) |
84% (2024) |
85% (2025) |
|
|
Transit
|
Indicators |
Previous Period |
Current Period |
Trend (Yearly) |
|---|---|---|---|
|
Light Rail Annual Ridership (in millions) |
4.5 (2023) |
4.9 (2024) |
|
|
Bus Annual Ridership (in millions) |
21.4 (2023) |
23.9 (2024) |
|
Inventory Assets
|
Assets |
Quantity |
Year Collected |
|---|---|---|
|
Local Roadway Lane Miles Maintained (Total) |
9,748 miles |
2024 |
|
Local Roadway Lane Miles Repaired/Repaved (Total) |
2,135 miles |
2024 |
|
Miles Repaired/Repaved 2021 |
696 miles |
2024 |
|
Miles Repaired/Repaved 2022 |
689 miles |
2024 |
|
Miles Repaired/Repaved 2023 |
749 miles |
2024 |
|
Bus |
|
|
|
Fleet Age (avg.) |
11.9 Years |
2024 |
|
Fleet Size |
431 |
2024 |
|
Route Mileage |
1,265 miles |
2024 |
|
Routes |
61 |
2024 |
|
Stops |
3,188 |
2024 |
|
Light Rail |
|
|
|
Fleet Size |
98 |
2024 |
|
Miles of Track |
81.6 miles |
2024 |
|
Route Mileage |
42.2 miles |
2024 |
|
Stations |
59 |
2024 |
|
Highway – Ramp Meter Signals |
265 Operational 12 Non-operational 62 Planned 26 Part construction |
2021 |
|
Traffic Signal Controllers |
1,964 Local 145 State |
2024 |
|
Traffic Signs |
209,984 |
2024 |
Sources:
Bridges
The conditions of Santa Clara County bridges and overcrossings were retrieved from the Federal Highway Administration National Bridge Inventory (NBI) website at National Bridge Inventory - Management and Preservation - Bridges & Structures - Federal Highway Administration (dot.gov). The raw data was aggregated and summarized by “good”, “fair”, and “poor” condition indicators.
Roadside Assets
The data was obtained from responses to the 2025 Roadside Assets Condition Self-Assessment Surveys completed by VTA’s member agency local jurisdictions.
Transit
Statistics on transit ridership were obtained from American Public Transportation Association (APTA) Fourth Quarter 2024 Report for Santa Clara Valley Transportation Authority.
Inventory of Assets
Roadway Lane Miles Maintained and Repaired/Repaved
The data was obtained from responses to the 2025 Roadside Assets Condition Self-Assessment Surveys completed by VTA’s member agency local jurisdictions.
Bus
The data for VTA’s bus fleet was obtained from an internal document, “VTA Facts, Current Bus System Data, 2025” produced by VTA’s Transit Operations Analysis and Reporting Department. The bus fleet includes all the following bus types: 30 foot (38), 40 ft hybrid (264), 40 ft standard (24), artic 60 foot (75), express (40), and electric (0). Bus route mileage is reported as the total round trip.
Light Rail
The data for VTA’s light rail fleet was obtained from an internal document, “VTA Facts, Current Bus System Data, 2025” produced by VTA’s Transit Operations Analysis and Reporting Department. In addition to the fleet of 98 standard vehicles, there are also 4 historic trollies that operate during the Christmas holiday season. Route miles define the extent of the operational network and represent the total extent of routes available for trains to operate. Track miles take into account multiple track routes (e.g. for each route mile where there is double track, there are two track miles; where there are four tracks, there are four track miles).
Highway – Ramp Meter Signals
Data provided by Caltrans District 4 Office of Traffic Systems staff.
Traffic Signal Controllers
Data provided by Caltrans District 4 Office of Traffic Systems staff and responses to the 2025 Roadside Assets Condition Self-Assessment Surveys completed by VTA’s member agency local jurisdictions.
Traffic Signs
The data was obtained from responses to the 2025 Roadside Assets Condition Self-Assessment Surveys completed by VTA’s member agency local jurisdictions.