Background
Transportation has a significant effect on public health and safety, specifically collisions which are considered to be preventable. Santa Clara County has joined a nationwide effort to reduce and eventually eliminate all fatal and serious injury collisions on our roadways, while increasing safe, healthy, and equitable mobility for all users. The first step to achieving this goal is monitoring the collision rates, locations, and types.
Data Source
VTA and its Member agencies have invested in the County’s Crossroads Collision software database as a primary source for tracking and analyzing collisions. Crossroads includes data from the Statewide Integrated Traffic Records System (SWITRS) in addition to the non-serious collisions collected by the local police departments that might not be reported to the State. This provides a more comprehensive database tool for use by local transportation engineers, planners, and public health department staff.
Conditions
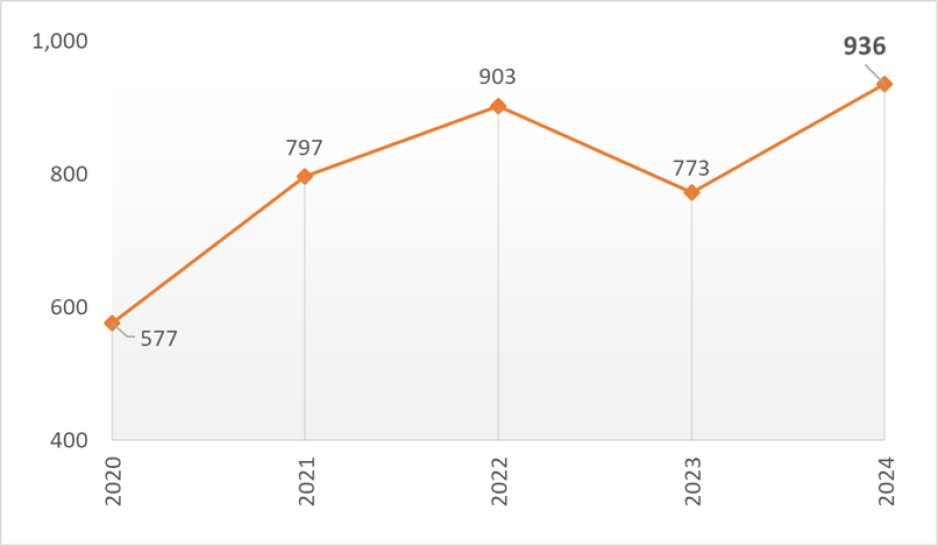
After an initial decrease in traffic during the COVID-19 pandemic in 2020, which resulted in changes in work schedule, mode choices, and travel patterns, traffic is now rebounding to higher levels as employees are shifting to hybrid work schedules. In general, there was a 1.4% decrease in the number of collisions between 2023 and 2024:
- -213 (-1.4%) Total Collisions
- -39 (-42%) Fatal Collisions
- -311 (-5%) Injury Collisions
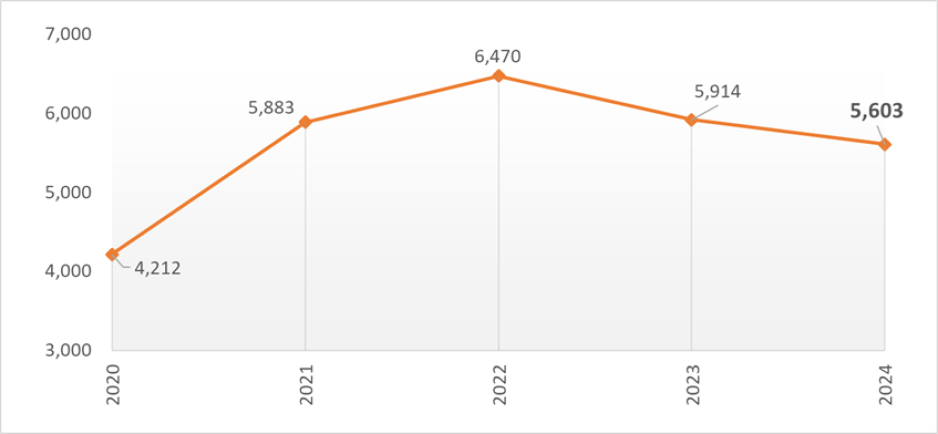
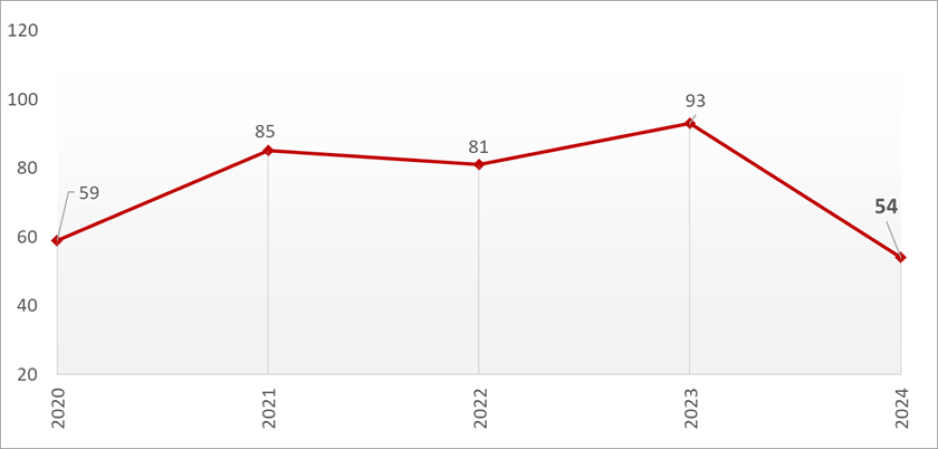
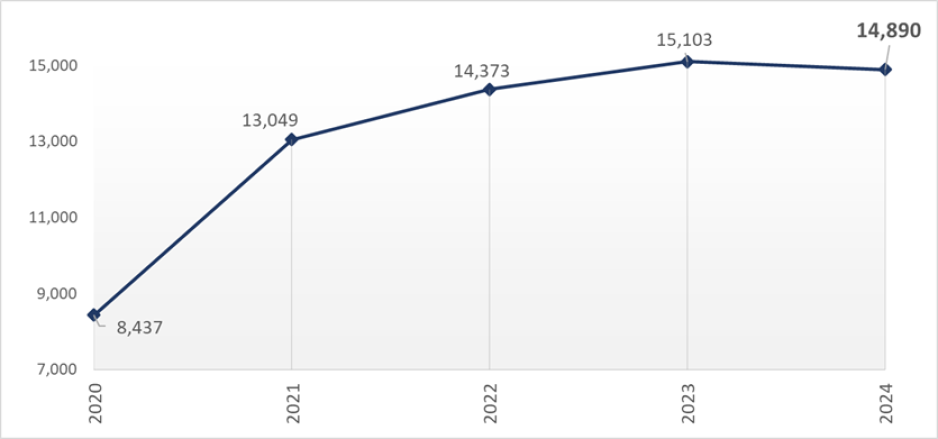
The following graphs show the historical Fatal and Injury Collision trends from 2020 to 2024. The following maps display “hot spots” of frequent locations by type.
|
Figure 1. Historical Injury Collisions in Santa Clara County
|
Figure 2. Historical Fatal Collisions in Santa Clara County
|
Figure 3. Historical Total Collisions in Santa Clara County
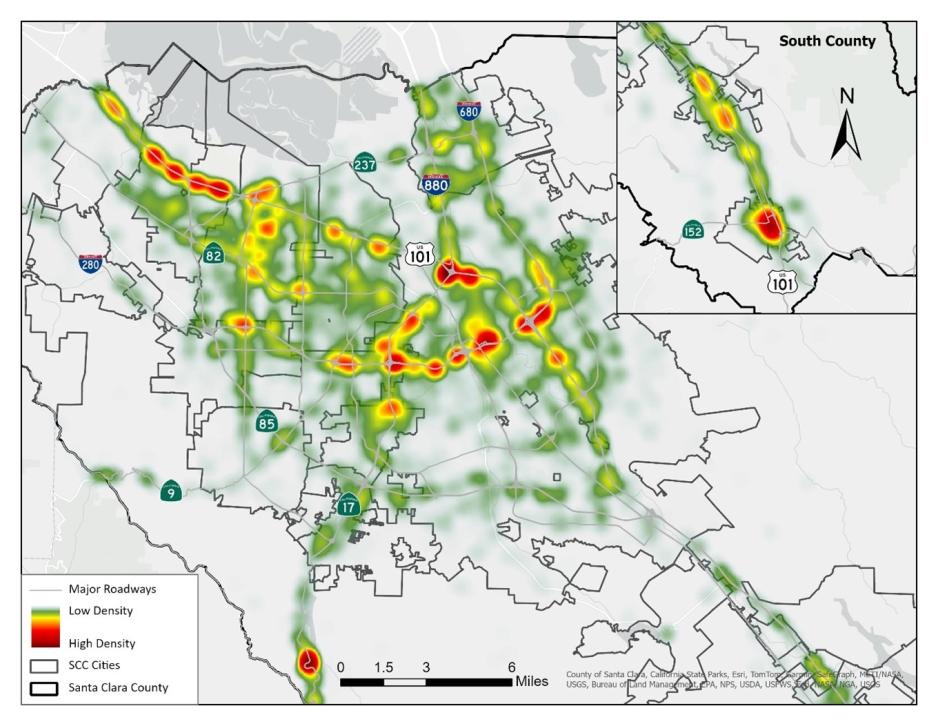
Figure 4. 2024 All Collisions “Hot Spot” Map, Santa Clara County
(View and download the data related to the map)
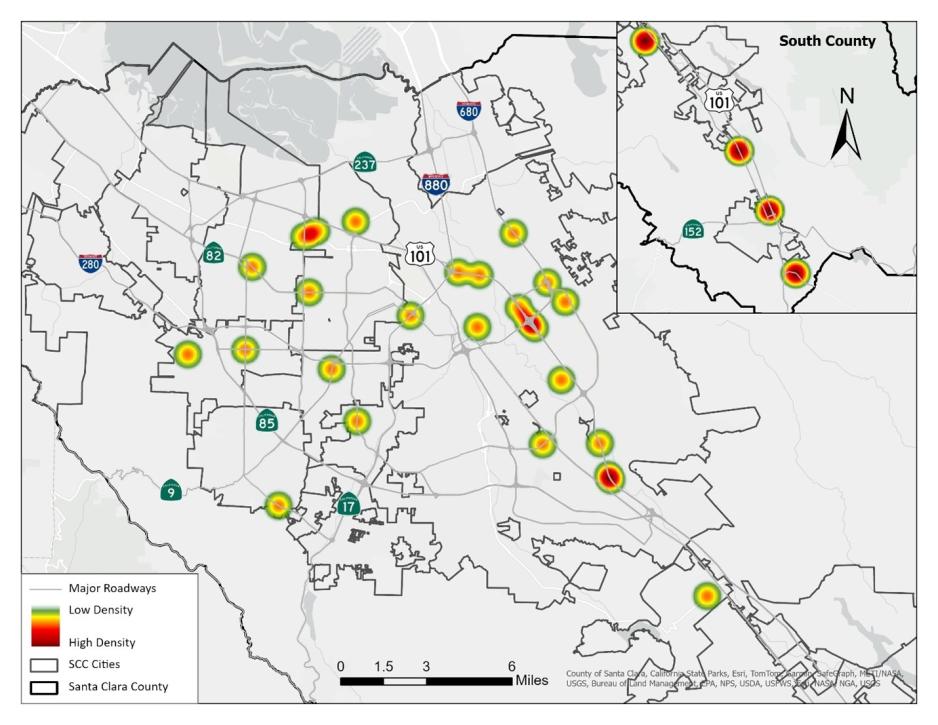
Figure 5. 2024 Fatal Collisions “Hot Spot” Map, Santa Clara County
(View and download the data related to the map)
The overall number of 2024 major collision types, factors, and involved parties by agencies are presented in the following table:
|
Agency |
Total Collisions |
Fatal Collisions |
Injury Collisions |
Hit & Run |
DUI* |
Speed |
Auto R/W** |
Ped |
Bike |
Hit Object |
|---|---|---|---|---|---|---|---|---|---|---|
|
Campbell |
301 |
1 |
99 |
96 |
52 |
33 |
21 |
14 |
15 |
70 |
|
Cupertino |
466 |
2 |
99 |
113 |
16 |
58 |
27 |
17 |
22 |
47 |
|
Gilroy |
241 |
1 |
80 |
71 |
16 |
49 |
33 |
12 |
8 |
22 |
|
Los Altos |
15 |
0 |
8 |
1 |
0 |
2 |
2 |
0 |
2 |
3 |
|
Los Altos Hills |
48 |
1 |
15 |
5 |
5 |
14 |
2 |
0 |
3 |
26 |
|
Los Gatos |
156 |
0 |
69 |
39 |
8 |
17 |
9 |
9 |
16 |
41 |
|
Milpitas |
290 |
0 |
123 |
90 |
23 |
58 |
38 |
16 |
16 |
57 |
|
Monte Sereno |
2 |
0 |
0 |
2 |
0 |
0 |
0 |
0 |
0 |
0 |
|
Morgan Hill |
76 |
0 |
37 |
12 |
12 |
15 |
8 |
1 |
5 |
26 |
|
Mountain View |
221 |
0 |
123 |
43 |
42 |
18 |
20 |
22 |
27 |
44 |
|
Palo Alto |
72 |
0 |
44 |
4 |
6 |
9 |
15 |
1 |
15 |
11 |
|
San Jose |
1860 |
7 |
1738 |
280 |
50 |
360 |
141 |
241 |
172 |
97 |
|
Santa Clara |
963 |
1 |
339 |
370 |
76 |
182 |
99 |
36 |
35 |
123 |
|
Santa Clara County |
1325 |
8 |
854 |
215 |
81 |
444 |
116 |
47 |
69 |
304 |
|
Saratoga |
169 |
1 |
63 |
24 |
6 |
43 |
28 |
4 |
13 |
35 |
|
State |
7568 |
29 |
1502 |
1614 |
422 |
4154 |
68 |
46 |
36 |
1364 |
|
Sunnyvale |
1101 |
3 |
408 |
396 |
71 |
262 |
121 |
57 |
56 |
123 |
*DUI - Driving Under the Influence
**Auto R/W - vehicle's Right-Of-Way violation
Collision types and primary collision factors (PCF)
Every collision record identifies the type of collision and a primary collision factor. This information is used to develop counter measures and strategies to mitigate these types of collisions. The following graphs show the percentages of collision by type and primary factors or causes.
|
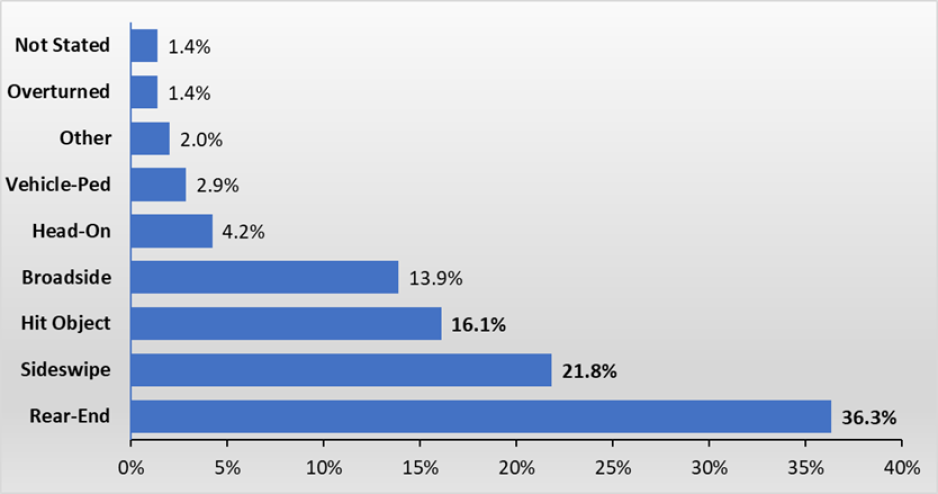
Figure 6. 2024 All Collision – Collision Types
|
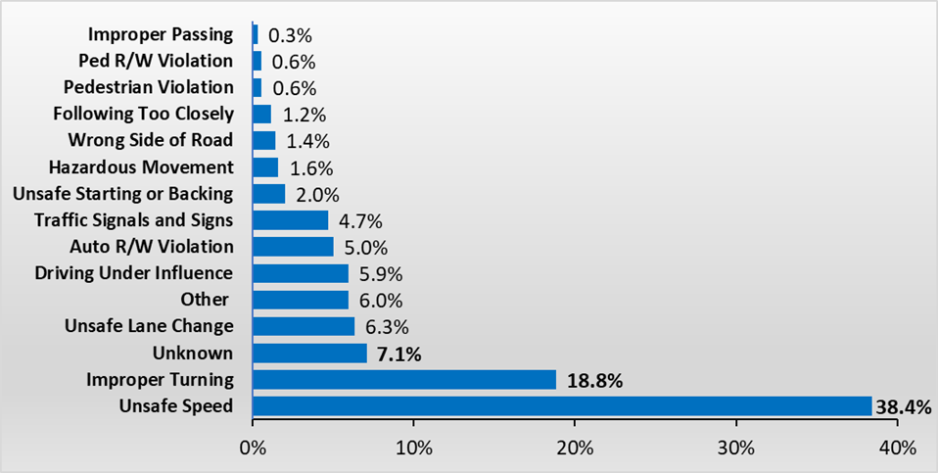
Figure 7. 2024 All Collision – Primary Collision Factor (PCF)
Pedestrian and Bicycle Involved Collisions
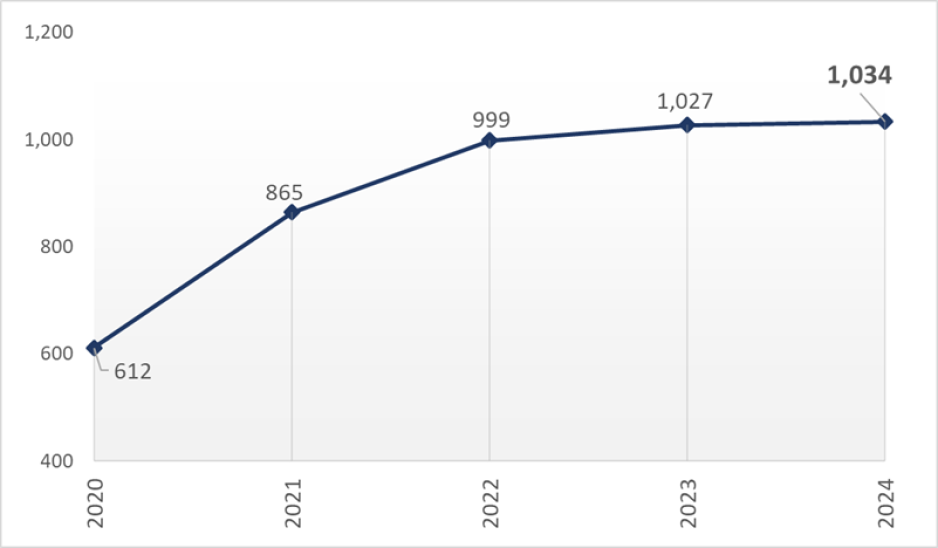
In 2024, there were 1,034 collisions involving bicyclists and pedestrians out of a total of 14,890 reported collisions in Santa Clara County. The number of bicycle and pedestrian collisions increased by 7 or nearly 1% in 2024 compared to 2023 data:
- +7 (+0.7%) Total Collisions
- -7 (-22%) Fatal Collisions
- +163 (+21%) Injury Collisions
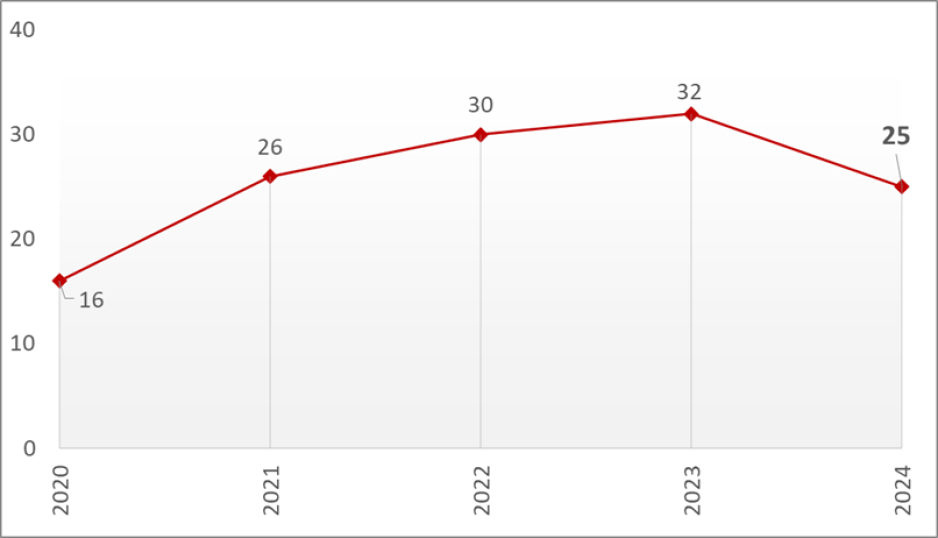
The following graphs show the historical Fatal, Injury, and Total bicycle and pedestrian involved collision trends from 2020 to 2024.
|
Figure 8. Historical Injury Bike/Ped Collisions in Santa Clara County
|
Figure 9. Historical Fatal Bike/Ped Collisions in Santa Clara County
|
Figure 10. Historical Total Bike/Ped Collisions in Santa Clara County
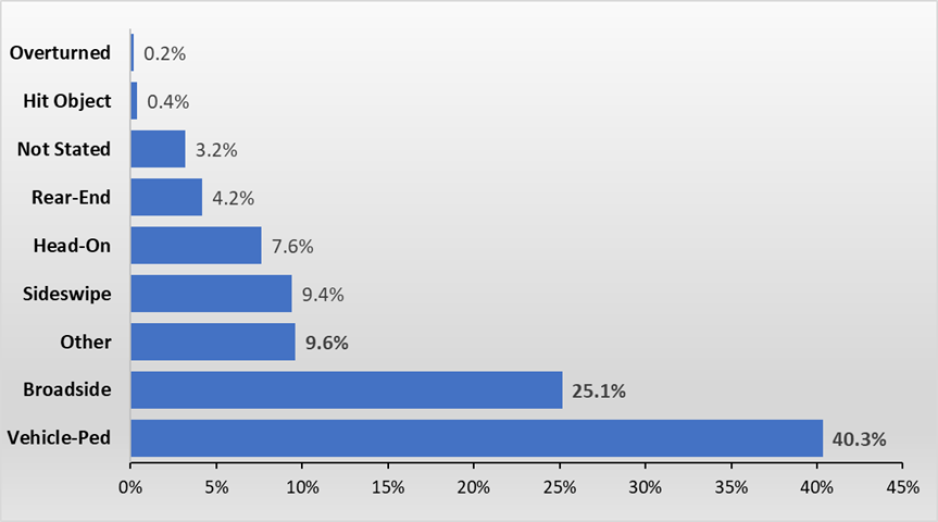
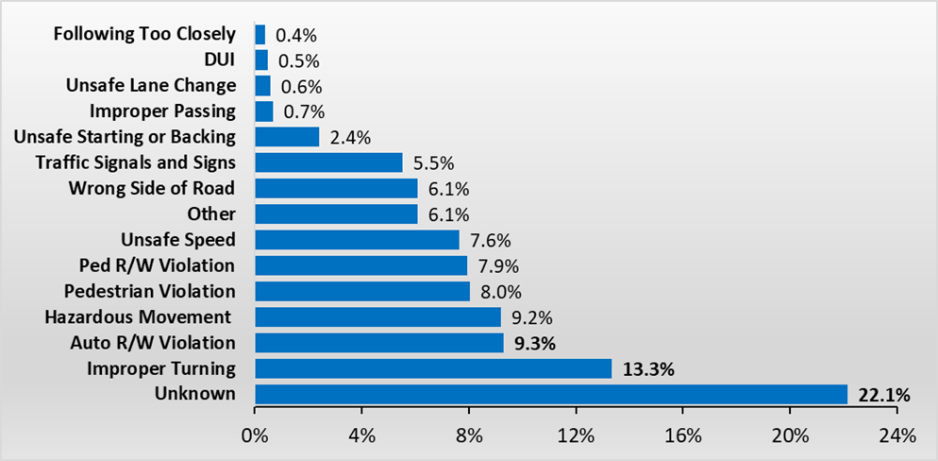
The following graphs show the percentages of bicycle and pedestrian involved collisions by type and primary factors or causes.
|
Figure 11. 2024 Bike/Ped Collision – Collision Types
|
Figure 12. 2024 Bike/Ped Collision – Primary Collision Factors (PCF)
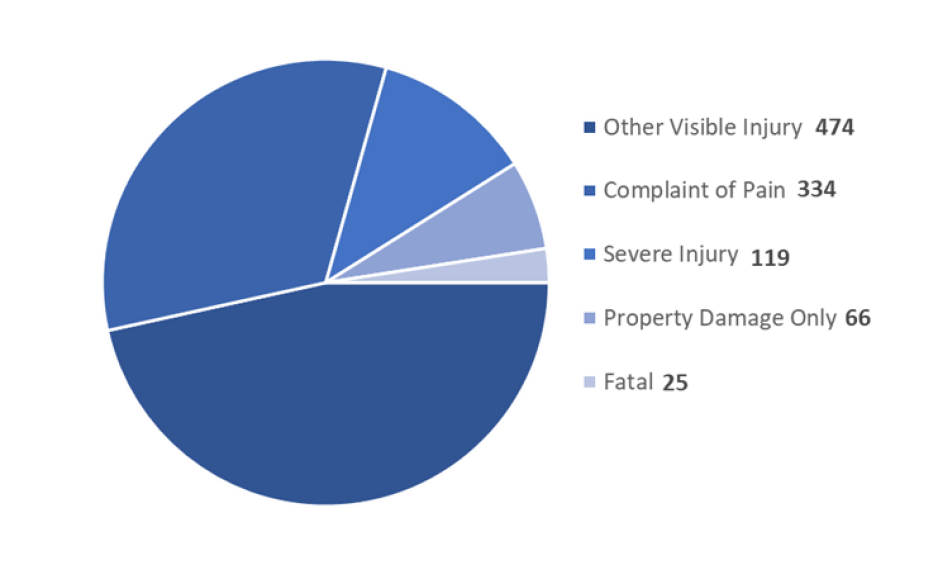
|
Figure 13. 2024 Bike/Ped Collision – Degree of Injury
Frequent Collision Locations Involving Bicyclists and Pedestrians
Monitoring and tracking locations of collisions year over year is a good performance metric for evaluating the effectiveness of collision reduction projects and strategies. The hotspot map below shows the location of bicycles and pedestrian collisions in 2024.
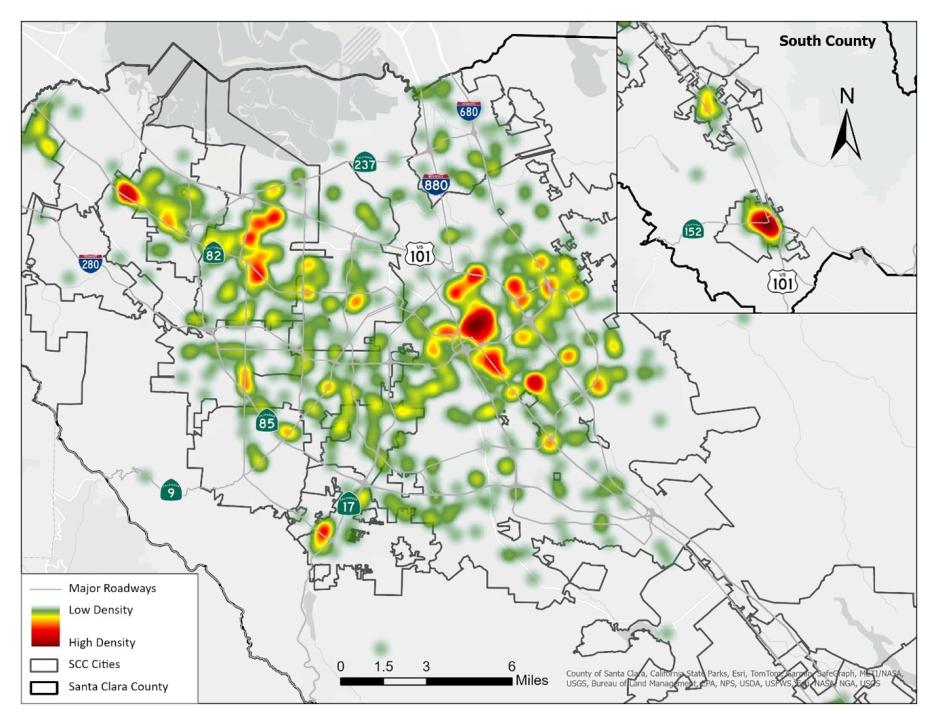
Figure 14. 2024 Bike and Pedestrian Collisions “Hot Spot” Map, Santa Clara County
(View and download the data related to the map)
Acronym:
DUI: Driving Under the Influence
PCF: Primary Collision Factor
RW: Right-Of-Way
Sources:
The Countywide Crossroads Collision Database, maintained by Santa Clara County’s Roads and Airports Department was used to generate the collision data for this section. The data includes reports from the Statewide Integrated Traffic Records System and local agency police departments. The collision maps were generated using Esri ArcGIS Pro software.
Background
Transportation has a significant effect on public health and safety, specifically collisions which are considered to be preventable. Santa Clara County has joined a nationwide effort to reduce and eventually eliminate all fatal and serious injury collisions on our roadways, while increasing safe, healthy, and equitable mobility for all users. The first step to achieving this goal is monitoring the collision rates, locations, and types.
Data Source
VTA and its Member agencies have invested in the County’s Crossroads Collision software database as a primary source for tracking and analyzing collisions. Crossroads includes data from the Statewide Integrated Traffic Records System (SWITRS) in addition to the non-serious collisions collected by the local police departments that might not be reported to the State. This provides a more comprehensive database tool for use by local transportation engineers, planners, and public health department staff.
Conditions
After an initial decrease in traffic during the COVID-19 pandemic in 2020, which resulted in changes in work schedule, mode choices, and travel patterns, traffic is now rebounding to higher levels as employees are shifting to hybrid work schedules. In general, there was a 1.4% decrease in the number of collisions between 2023 and 2024:
- -213 (-1.4%) Total Collisions
- -39 (-42%) Fatal Collisions
- -311 (-5%) Injury Collisions
The following graphs show the historical Fatal and Injury Collision trends from 2020 to 2024. The following maps display “hot spots” of frequent locations by type.
|
|
Figure 1. Historical Injury Collisions in Santa Clara County
|
|
Figure 2. Historical Fatal Collisions in Santa Clara County
|
|
Figure 3. Historical Total Collisions in Santa Clara County
Figure 4. 2024 All Collisions “Hot Spot” Map, Santa Clara County
(View and download the data related to the map)
Figure 5. 2024 Fatal Collisions “Hot Spot” Map, Santa Clara County
(View and download the data related to the map)
The overall number of 2024 major collision types, factors, and involved parties by agencies are presented in the following table:
|
Agency |
Total Collisions |
Fatal Collisions |
Injury Collisions |
Hit & Run |
DUI* |
Speed |
Auto R/W** |
Ped |
Bike |
Hit Object |
|---|---|---|---|---|---|---|---|---|---|---|
|
Campbell |
301 |
1 |
99 |
96 |
52 |
33 |
21 |
14 |
15 |
70 |
|
Cupertino |
466 |
2 |
99 |
113 |
16 |
58 |
27 |
17 |
22 |
47 |
|
Gilroy |
241 |
1 |
80 |
71 |
16 |
49 |
33 |
12 |
8 |
22 |
|
Los Altos |
15 |
0 |
8 |
1 |
0 |
2 |
2 |
0 |
2 |
3 |
|
Los Altos Hills |
48 |
1 |
15 |
5 |
5 |
14 |
2 |
0 |
3 |
26 |
|
Los Gatos |
156 |
0 |
69 |
39 |
8 |
17 |
9 |
9 |
16 |
41 |
|
Milpitas |
290 |
0 |
123 |
90 |
23 |
58 |
38 |
16 |
16 |
57 |
|
Monte Sereno |
2 |
0 |
0 |
2 |
0 |
0 |
0 |
0 |
0 |
0 |
|
Morgan Hill |
76 |
0 |
37 |
12 |
12 |
15 |
8 |
1 |
5 |
26 |
|
Mountain View |
221 |
0 |
123 |
43 |
42 |
18 |
20 |
22 |
27 |
44 |
|
Palo Alto |
72 |
0 |
44 |
4 |
6 |
9 |
15 |
1 |
15 |
11 |
|
San Jose |
1860 |
7 |
1738 |
280 |
50 |
360 |
141 |
241 |
172 |
97 |
|
Santa Clara |
963 |
1 |
339 |
370 |
76 |
182 |
99 |
36 |
35 |
123 |
|
Santa Clara County |
1325 |
8 |
854 |
215 |
81 |
444 |
116 |
47 |
69 |
304 |
|
Saratoga |
169 |
1 |
63 |
24 |
6 |
43 |
28 |
4 |
13 |
35 |
|
State |
7568 |
29 |
1502 |
1614 |
422 |
4154 |
68 |
46 |
36 |
1364 |
|
Sunnyvale |
1101 |
3 |
408 |
396 |
71 |
262 |
121 |
57 |
56 |
123 |
*DUI - Driving Under the Influence
**Auto R/W - vehicle's Right-Of-Way violation
Collision types and primary collision factors (PCF)
Every collision record identifies the type of collision and a primary collision factor. This information is used to develop counter measures and strategies to mitigate these types of collisions. The following graphs show the percentages of collision by type and primary factors or causes.
|
|
Figure 6. 2024 All Collision – Collision Types
|
|
Figure 7. 2024 All Collision – Primary Collision Factor (PCF)
Pedestrian and Bicycle Involved Collisions
In 2024, there were 1,034 collisions involving bicyclists and pedestrians out of a total of 14,890 reported collisions in Santa Clara County. The number of bicycle and pedestrian collisions increased by 7 or nearly 1% in 2024 compared to 2023 data:
- +7 (+0.7%) Total Collisions
- -7 (-22%) Fatal Collisions
- +163 (+21%) Injury Collisions
The following graphs show the historical Fatal, Injury, and Total bicycle and pedestrian involved collision trends from 2020 to 2024.
|
|
Figure 8. Historical Injury Bike/Ped Collisions in Santa Clara County
|
|
Figure 9. Historical Fatal Bike/Ped Collisions in Santa Clara County
|
|
Figure 10. Historical Total Bike/Ped Collisions in Santa Clara County
The following graphs show the percentages of bicycle and pedestrian involved collisions by type and primary factors or causes.
|
|
Figure 11. 2024 Bike/Ped Collision – Collision Types
|
|
Figure 12. 2024 Bike/Ped Collision – Primary Collision Factors (PCF)
|
|
Figure 13. 2024 Bike/Ped Collision – Degree of Injury
Frequent Collision Locations Involving Bicyclists and Pedestrians
Monitoring and tracking locations of collisions year over year is a good performance metric for evaluating the effectiveness of collision reduction projects and strategies. The hotspot map below shows the location of bicycles and pedestrian collisions in 2024.
Figure 14. 2024 Bike and Pedestrian Collisions “Hot Spot” Map, Santa Clara County
(View and download the data related to the map)
Acronym:
DUI: Driving Under the Influence
PCF: Primary Collision Factor
RW: Right-Of-Way
Sources:
The Countywide Crossroads Collision Database, maintained by Santa Clara County’s Roads and Airports Department was used to generate the collision data for this section. The data includes reports from the Statewide Integrated Traffic Records System and local agency police departments. The collision maps were generated using Esri ArcGIS Pro software.