Inventory
There are approximately 10,200 miles of pavement in Santa Clara County maintained by local agencies. The term lane miles is a measure of road length representing the number of miles of every driving lane, and is used to better reflect the total amount of pavement that needs to be maintained.
Condition
PCI Definition
PCI is based on the number and severity of pavement distresses observed during a visual inspection of a roadway and is expressed as a numerical index between 0 and 100. Zero is the worst or failed condition and 100 represents a roadway that is in excellent or new condition.
| Condition (PCI) | Description |
|---|---|
| Excellent (90–100) | Newly constructed or resurfaced and almost no signs of distress. |
| ✔ Very Good (80–89) | Newly constructed or resurfaced and have few if any signs of distress. |
| Good (70–79) | Show only low levels of distress, such as minor cracks or surface damage. |
| Fair (60–69) | Pavements exhibit significant levels of distress and require a combination of rehabilitation and other preventive maintenance to keep them from deteriorating. |
| At risk (50–59) | Pavements are deteriorated and require immediate attention and possibly rehabilitative work; ride quality is significantly inferior. |
| Poor (25–49) | Pavements have extensive amounts of distress and require major rehabilitation or reconstruction; affect the speed and flow of traffic significantly. |
| Failed (0–24) | Pavements need reconstruction and are extremely rough and difficult to drive on. |
Pavement Condition Index (PCI)
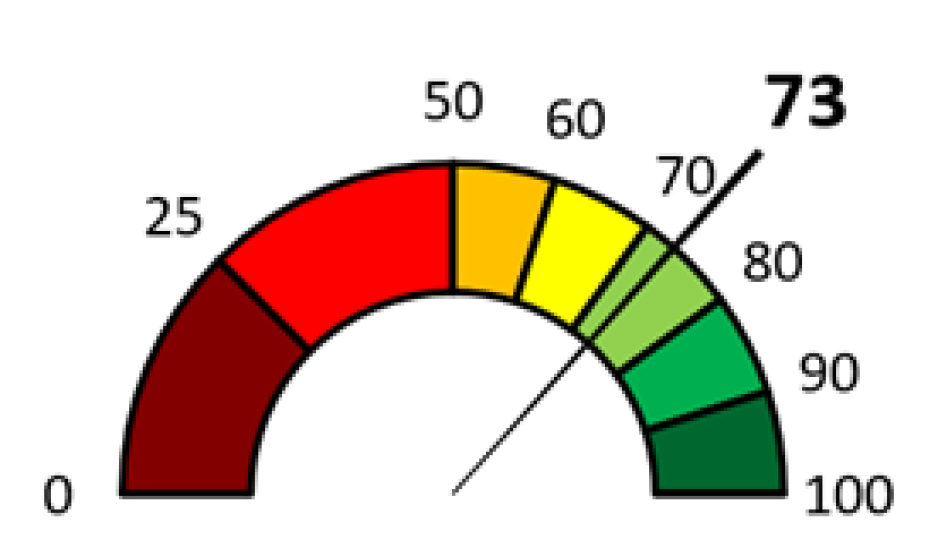
The average PCI score for Santa Clara County’s roadways is 73 (Good), compared with the Bay Area’s regional PCI of 67 (Fair) and the goal of 75 (Good).
The PCI score represents a weighted average based on a percentage of the roadway network by category (e.g. arterial, collector and residential). This measurement accounts for incremental wear of roadways over time.
|
Figure 1. Current Overall Santa Clara County PCI
Condition and Pavement Evaluation
PCI is based on a visual assessment of the roadways’ top surface layer. Pavement deterioration that originates below the surface are not typically noticed until they “make their way up” to the surface appearing in the form of cracks or depressions. These distressed conditions can originate from deteriorating underlying pavement, base, sub-base, and subgrade layers.
In addition to PCI, there are other methods of determining pavement conditions. However, many of these methods are too detailed and expensive for frequent reporting purposes.
PCI Trend
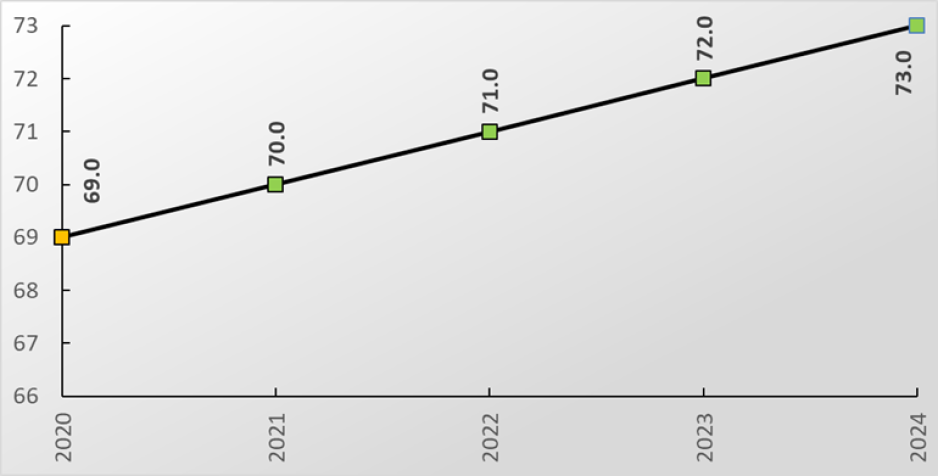
The graph in Figure 2 shows a 5-year trend (2020 to 2024) of incremental, year over year improvements in pavement conditions from PCI scores of 69 to 73.
|
Figure 2. PCI Trend
PCI Scores by Jurisdiction in Santa Clara County
The Pavement Condition in Santa Clara County varies by local jurisdiction. Each jurisdiction’s PCI is evaluated separately, and the weighted average is used to determine the overall PCI.
Table 1 below shows the PCI scores for each of Santa Clara County’s 16 local jurisdictions, ranked from Very Good to At Risk condition and the change in PCI from 2023 to 2024. Eight of sixteen jurisdictions experienced decrease in PCI from 2022 to 2023, two had no change in PCI, and six jurisdictions showed improvements in their pavement conditions.
| Jurisdiction per Category | Annual Network PCI Scores 2023 | Annual Network PCI Scores 2024 | Change 2023 to 2024 |
|---|---|---|---|
| VERY GOOD (PCI = 80-89) | |||
| Palo Alto | 84 | 83 | -1 |
| Cupertino | 81 | 82 | 1 |
| Los Gatos | 75 | 82 | 7 |
| Los Altos Hills | 79 | 81 | 2 |
| GOOD (PCI = 70-79) | |||
| Morgan Hill | 75 | 74 | -1 |
| Santa Clara | 75 | 74 | -1 |
| Sunnyvale | 74 | 74 | 0 |
| San Jose | 73 | 74 | 1 |
| Monte Sereno | 70 | 74 | 4 |
| Los Altos | 73 | 71 | -2 |
| Milpitas | 71 | 71 | 0 |
| FAIR (PCI = 60-69) | |||
| Santa Clara County | 65 | 67 | 2 |
| Saratoga | 67 | 66 | -1 |
| Mountain View | 67 | 65 | -2 |
| Campbell | 66 | 64 | -2 |
| Gilroy | 64 | 64 | 0 |
Peer County Comparison
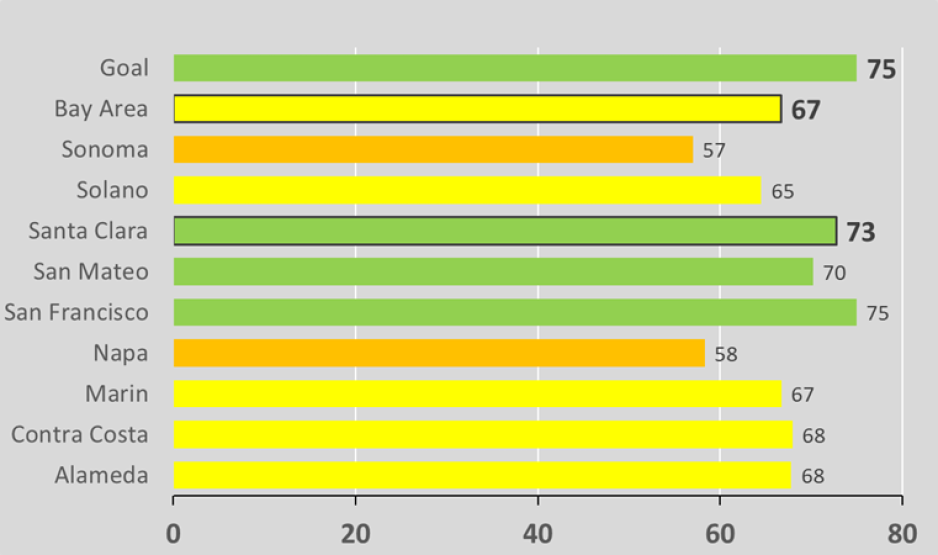
The PCI Goal established for the Bay Area’s local roadways is 75. Santa Clara County’s roadways with a PCI score of 73 (Good) is better than the Bay Area’s PCI Average of 67 (Fair).
|
Figure 3. Bay Area 2024 Average PCI
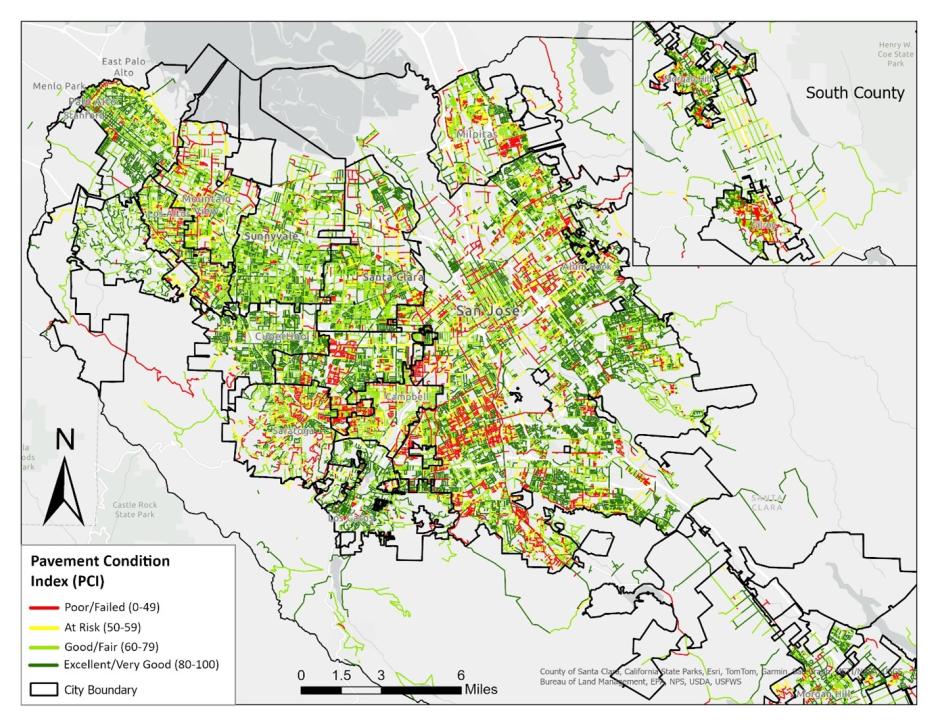
Figure 4. Santa Clara County 2024 Local Streets PCI map
(view and download the data related to the map)
The average PCI score for Santa Clara County has been stable for the last 5 years, 69 to 73 at the borderline between Fair to Good condition. General comments from the local agencies suggest the recent upward trend can be attributed to the increased number of roadway lane miles repaired or rehabilitated.
Based on the 2023 California Statewide Local Streets and Roads Needs Assessment annual report by the California State Association of Counties and League of California of Cities, Santa Clara County’s needs are estimated at $2.5 Billion over the next 10 years to eliminate the backlog of maintenance repairs to achieve a best management practice PCI score of 80 or better, or Very Good condition. This cost is based on Santa Clara County’s 10,200 lane miles.
Solutions
To help address the funding needs to maintain Santa Clara County’s roadways to a state of good repair, Santa Clara County voters approved a $10 Vehicle Registration Fee (VRF) in November 2010. The funds are used to pay for improvements in local transportation, including pothole repair, paving, traffic control signals, and safety improvements. The VRF Program generates approximately $14 million annually and is distributed to cities to help fund their highest priority roadway improvements.
In FY 2024-2025, nearly $67.0 million was distributed to VTA’s Member Agency jurisdictions through the VRF and 2016 Measure B Local Road and Repair Programs. Some agencies are combining funds over multiple years and/or combining them with other funding sources to finance large multi-year projects. More detailed information on the distribution of funds to the individual jurisdictions and their projects can be found on VTA’s 2010 $10 Vehicle Registration Fee and 2016 Measure B Local Streets & Roads Program webpages.
Acronyms:
MTC: Metropolitan Transportation Commission
PCI: Pavement Condition Index
VRF: Vehicle Registration Fee
Sources:
- Local Streets Pavement Condition Index (PCI) maps were downloaded from the Metropolitan Transportation Commission’s (MTC) Vital Signs website. Additional PCI data was obtained from MTC staff.
- April 2023 California Statewide Local Streets and Roads Needs Assessment Final Report
- VTA 2010 $10 Vehicle Registration Fee webpage
Inventory
There are approximately 10,200 miles of pavement in Santa Clara County maintained by local agencies. The term lane miles is a measure of road length representing the number of miles of every driving lane, and is used to better reflect the total amount of pavement that needs to be maintained.
Condition
PCI Definition
PCI is based on the number and severity of pavement distresses observed during a visual inspection of a roadway and is expressed as a numerical index between 0 and 100. Zero is the worst or failed condition and 100 represents a roadway that is in excellent or new condition.
| Condition (PCI) | Description |
|---|---|
| Excellent (90–100) | Newly constructed or resurfaced and almost no signs of distress. |
| ✔ Very Good (80–89) | Newly constructed or resurfaced and have few if any signs of distress. |
| Good (70–79) | Show only low levels of distress, such as minor cracks or surface damage. |
| Fair (60–69) | Pavements exhibit significant levels of distress and require a combination of rehabilitation and other preventive maintenance to keep them from deteriorating. |
| At risk (50–59) | Pavements are deteriorated and require immediate attention and possibly rehabilitative work; ride quality is significantly inferior. |
| Poor (25–49) | Pavements have extensive amounts of distress and require major rehabilitation or reconstruction; affect the speed and flow of traffic significantly. |
| Failed (0–24) | Pavements need reconstruction and are extremely rough and difficult to drive on. |
Pavement Condition Index (PCI)
The average PCI score for Santa Clara County’s roadways is 73 (Good), compared with the Bay Area’s regional PCI of 67 (Fair) and the goal of 75 (Good).
The PCI score represents a weighted average based on a percentage of the roadway network by category (e.g. arterial, collector and residential). This measurement accounts for incremental wear of roadways over time.
|
|
Figure 1. Current Overall Santa Clara County PCI
Condition and Pavement Evaluation
PCI is based on a visual assessment of the roadways’ top surface layer. Pavement deterioration that originates below the surface are not typically noticed until they “make their way up” to the surface appearing in the form of cracks or depressions. These distressed conditions can originate from deteriorating underlying pavement, base, sub-base, and subgrade layers.
In addition to PCI, there are other methods of determining pavement conditions. However, many of these methods are too detailed and expensive for frequent reporting purposes.
PCI Trend
The graph in Figure 2 shows a 5-year trend (2020 to 2024) of incremental, year over year improvements in pavement conditions from PCI scores of 69 to 73.
|
|
Figure 2. PCI Trend
PCI Scores by Jurisdiction in Santa Clara County
The Pavement Condition in Santa Clara County varies by local jurisdiction. Each jurisdiction’s PCI is evaluated separately, and the weighted average is used to determine the overall PCI.
Table 1 below shows the PCI scores for each of Santa Clara County’s 16 local jurisdictions, ranked from Very Good to At Risk condition and the change in PCI from 2023 to 2024. Eight of sixteen jurisdictions experienced decrease in PCI from 2022 to 2023, two had no change in PCI, and six jurisdictions showed improvements in their pavement conditions.
| Jurisdiction per Category | Annual Network PCI Scores 2023 | Annual Network PCI Scores 2024 | Change 2023 to 2024 |
|---|---|---|---|
| VERY GOOD (PCI = 80-89) | |||
| Palo Alto | 84 | 83 | -1 |
| Cupertino | 81 | 82 | 1 |
| Los Gatos | 75 | 82 | 7 |
| Los Altos Hills | 79 | 81 | 2 |
| GOOD (PCI = 70-79) | |||
| Morgan Hill | 75 | 74 | -1 |
| Santa Clara | 75 | 74 | -1 |
| Sunnyvale | 74 | 74 | 0 |
| San Jose | 73 | 74 | 1 |
| Monte Sereno | 70 | 74 | 4 |
| Los Altos | 73 | 71 | -2 |
| Milpitas | 71 | 71 | 0 |
| FAIR (PCI = 60-69) | |||
| Santa Clara County | 65 | 67 | 2 |
| Saratoga | 67 | 66 | -1 |
| Mountain View | 67 | 65 | -2 |
| Campbell | 66 | 64 | -2 |
| Gilroy | 64 | 64 | 0 |
Peer County Comparison
The PCI Goal established for the Bay Area’s local roadways is 75. Santa Clara County’s roadways with a PCI score of 73 (Good) is better than the Bay Area’s PCI Average of 67 (Fair).
|
|
Figure 3. Bay Area 2024 Average PCI
Figure 4. Santa Clara County 2024 Local Streets PCI map
(view and download the data related to the map)
The average PCI score for Santa Clara County has been stable for the last 5 years, 69 to 73 at the borderline between Fair to Good condition. General comments from the local agencies suggest the recent upward trend can be attributed to the increased number of roadway lane miles repaired or rehabilitated.
Based on the 2023 California Statewide Local Streets and Roads Needs Assessment annual report by the California State Association of Counties and League of California of Cities, Santa Clara County’s needs are estimated at $2.5 Billion over the next 10 years to eliminate the backlog of maintenance repairs to achieve a best management practice PCI score of 80 or better, or Very Good condition. This cost is based on Santa Clara County’s 10,200 lane miles.
Solutions
To help address the funding needs to maintain Santa Clara County’s roadways to a state of good repair, Santa Clara County voters approved a $10 Vehicle Registration Fee (VRF) in November 2010. The funds are used to pay for improvements in local transportation, including pothole repair, paving, traffic control signals, and safety improvements. The VRF Program generates approximately $14 million annually and is distributed to cities to help fund their highest priority roadway improvements.
In FY 2024-2025, nearly $67.0 million was distributed to VTA’s Member Agency jurisdictions through the VRF and 2016 Measure B Local Road and Repair Programs. Some agencies are combining funds over multiple years and/or combining them with other funding sources to finance large multi-year projects. More detailed information on the distribution of funds to the individual jurisdictions and their projects can be found on VTA’s 2010 $10 Vehicle Registration Fee and 2016 Measure B Local Streets & Roads Program webpages.
Acronyms:
MTC: Metropolitan Transportation Commission
PCI: Pavement Condition Index
VRF: Vehicle Registration Fee
Sources:
- Local Streets Pavement Condition Index (PCI) maps were downloaded from the Metropolitan Transportation Commission’s (MTC) Vital Signs website. Additional PCI data was obtained from MTC staff.
- April 2023 California Statewide Local Streets and Roads Needs Assessment Final Report
- VTA 2010 $10 Vehicle Registration Fee webpage