Background
VTA Technical Advisory Committee identified highway litter, landscape, and graffiti maintenance as major roadway maintenance issues. The accumulation of litter and graffiti are viewed as driver distractions and potential hazards, as well as having negative impacts on the environment. The cleanliness of the highways can also be perceived as a quality-of-life indicator representing the level of community civic pride to residents, regional travelers, and tourists.
Inventory
There are approximately 307 roadside miles (shoulder length miles), 128 interchanges, and 1,193 acres of landscaped area on the State’s highway system in Santa Clara County requiring regular maintenance.
Conditions
Monitoring litter and graffiti on roadways is a challenging task, as conditions are constantly changing throughout the year, and any single day “snapshot” would not be an accurate data source. Prior to 2019, a subjective drive-by approach using a visual assessment scale was used as a performance metric to assess littler and graffiti conditions. This methodology was changed to a new data source and performance metric provided by Caltrans to cubic yards of litter collected and square feet of graffiti removed. Caltrans maintenance crews now keep records of their maintenance work including an estimated amount of litter, graffiti, and illegal encampments removed by freeway segment locations. This data has been translated into visual graphs, tables, and heat maps.
Litter
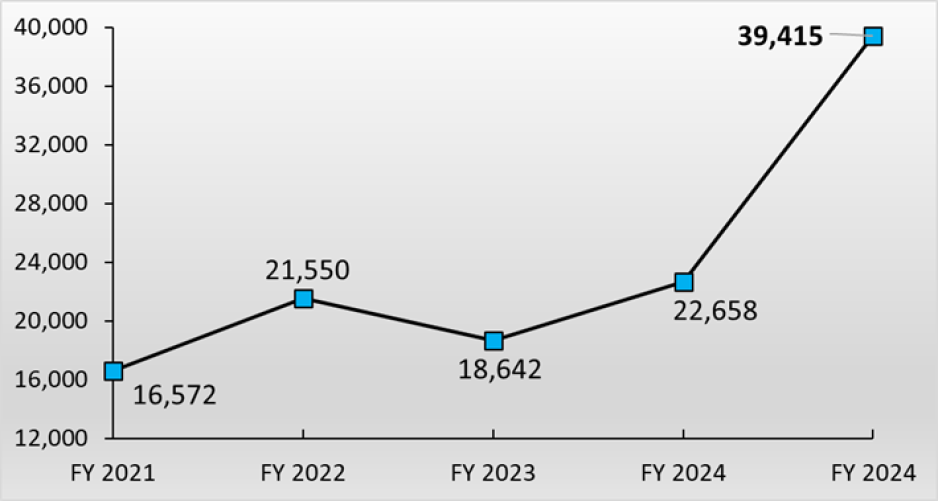
In FY 2025, an estimated 39,415 cubic yards of litter were picked up along the 307 highway shoulder miles in Santa Clara County. To provide some visual perspective, this equates to approximately 275,905 trash bags (1 cubic yard = 7 of 30-gallon sized trash bags) or approximately 23 football fields (300 ft. length x 160 ft. width).
|
Figure 1. 5-Year Total Litter Collection Trend
Compared to FY 2024, the amount of litter picked up increased by approximately 74% or 16,757 cubic yards (118,000 30-gallon trash bags). The reduction of litter on the roadways reduces distractions and risk of collisions.
The heatmap below depicts the locations and amount of litter collected in FY 2025. Caltrans maintenance crews typically clean each highway corridor two times a month throughout the year. The dark orange-reddish spots represent the areas with the most amounts of litter. The table shows the changes in amount of litter collected over a 5-year period by corridor routes.
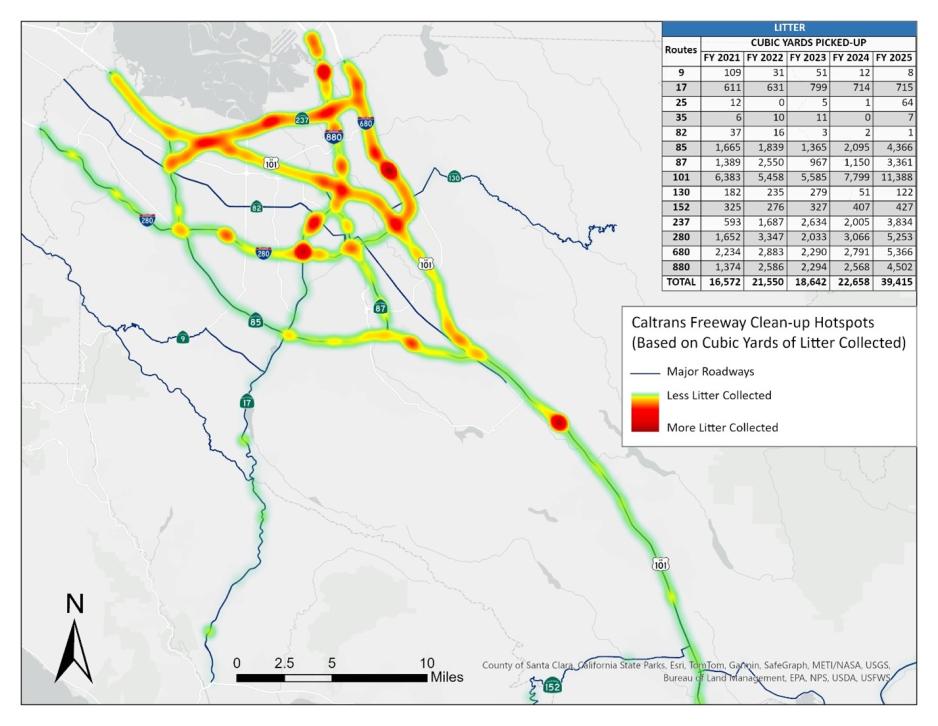
Figure 2. Hotspot Map of Litter in Cubic Yards Picked up along Highways in Santa Clara County, FY 2025
(View and download the data related to the map)
Illegal Encampments
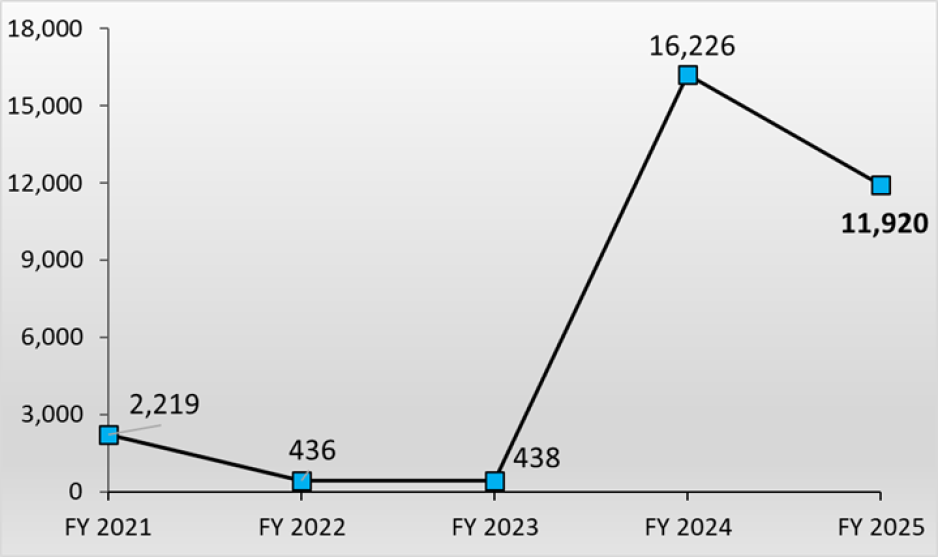
In addition to scheduled cleaning of the highway shoulders, Caltrans also recently started to record the location of illegal encampments and amount of litter collected at these sites. The encampment clean-up events require a 72-hour notice for the residents and are often repetitive. The data record shows that in FY 2025 an estimated 11,920 cubic yards of litter were removed from illegal encampments along the highways in Santa Clara County.
|
Figure 3. 5-Year Total Illegal Encampment Litter Collection Trend
Compared to FY 2024, the amount of litter picked up at illegal encampments during FY 2025 decreased by 4,306 cubic yards. The upward trend and improved conditions can be attributed to Caltrans Clean CA, CHP, and local agency increased efforts in past years to move the encampments off the highway system.
The heatmap in the Figure below shows the locations of the frequent illegal encampment locations along highways and amounts of litter collected at these sites. The data in the table also shows the amount of litter collected at the illegal encampments litter over a 5-year period by highway routes.
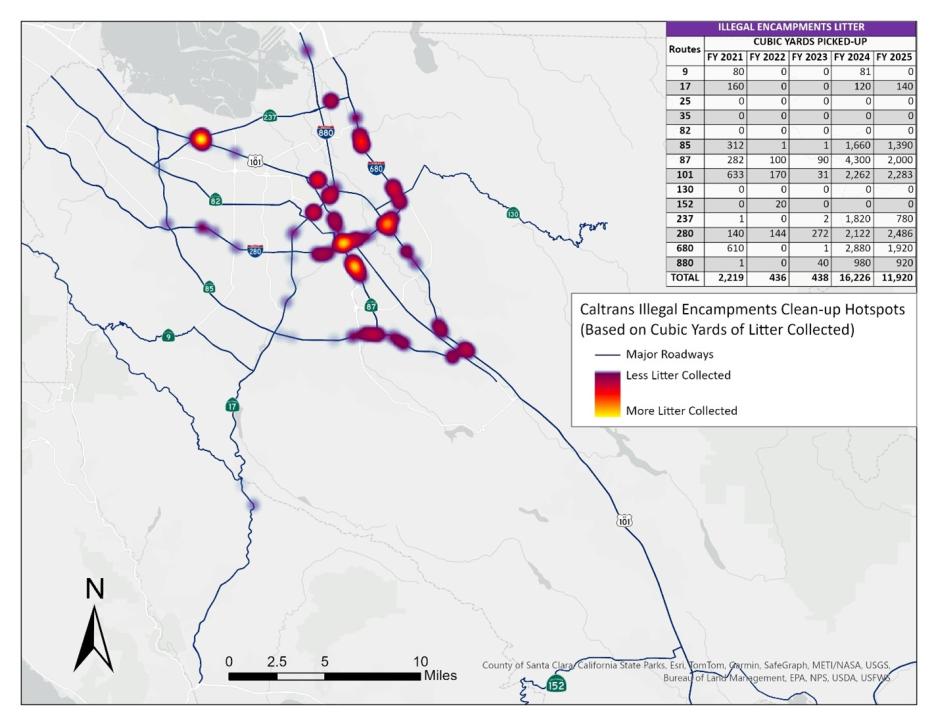
Figure 4. Hotspot Map of Illegal Encampments Litter in Cubic Yards Picked up along Highways in Santa Clara County, FY 2025
(View and download the data related to the map)
The locations with the most amount of litter collected can also indicate the size of the illegal encampments. For locations that are routinely occupied, preventive measures such as restrictive signs, fencing, installation of trash containers, and social service outreach can be implemented.
Graffiti
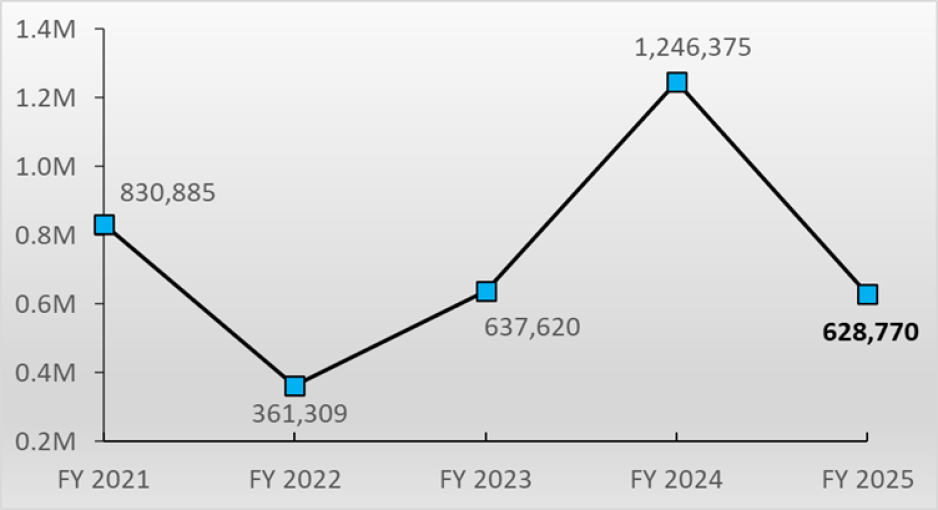
Graffiti and tagging on the highway system continues to be a problem in Santa Clara County. These incidents are typically seen on overcrossings, soundwalls, and signages. Caltrans maintenance crews and their contractors routinely patrol the highway corridors and either remove or paint over the graffiti. In FY 2025, an estimated 628,770 square feet of graffiti were removed along the highways in Santa Clara County. Compared to FY 2024, the amount of graffiti removed in FY 2025 decreased by approximately 50% or 617,605 square feet of graffiti.
|
Figure 5. 5-Year Total Graffiti Removal Trend
Caltrans graffiti removal efforts are conducted in partial segments of the highway, depending on the size and scale of the graffiti tags. The hotspot map below identifies the areas along highways with the largest number of square feet of graffiti removed. The data in the table also shows the changes in square footage of graffiti removed over a 5-year period by highway and freeway routes.
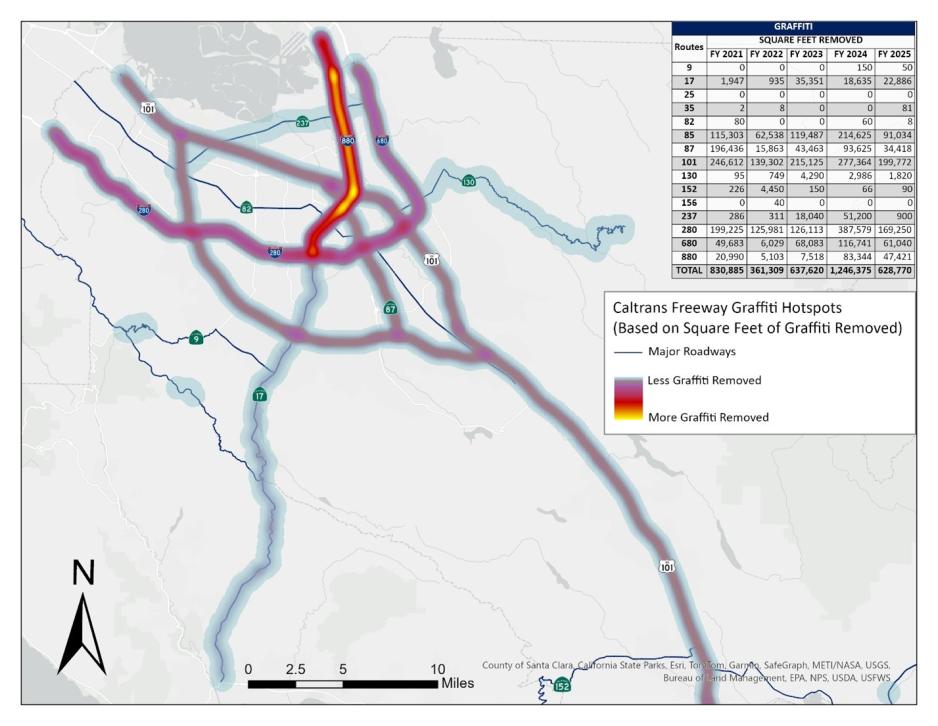
Figure 6. Surface Area of Graffiti per Mile Removed along Highways in Santa Clara County, FY 2025
(View and download the data related to the map)
The data collection for litter, illegal encampments, and graffiti could be improved if the amount cleaned could be reported in segments by post mile instead of corridors and by frequency.
SOLUTIONS
Keep Santa Clara Valley Beautiful is a countywide, multi-agency initiative to clean and prevent littering on the highways in Santa Clara County. Trash on the highways is hazardous to drivers, the environment, and residents. VTA is working together with several partners to develop a program to change people’s attitudes and behaviors towards throwing litter on the highways instead of in garbage cans or recycling containers.

The project includes organizing popup cleanup events in cities and towns throughout Santa Clara County, placing No Dumping enforcement signs at frequently littered locations, and forming local volunteer groups to help keep the community highways clean. In 2025, VTA, in partnership with Caltrans, Valley Water, CHP, and local jurisdictions, organized 7 volunteer cleanup events throughout the county, collected 310 30-gallon bags of trash, and rallied nearly 130 volunteers.
The map below shows the 2025 Keep Santa Clara Valley Beautiful cleanup locations along the highways in Santa Clara County.
Clean California - In July 2021, the State approved a $1.5 Billion 3-Year statewide transformation initiative to remove litter on the roadways, create jobs, and beautify California. VTA and local agencies in Santa Clara County are working with the Bay Area Local Caltrans District 4 Clean CA team to plan community volunteer clean-up events and free dump days in Santa Clara County. This program is scheduled to end in December 2026.
Adopt-A-Highway (AAH) – This is a Caltrans program that allows community volunteers and organizations to help maintain sections of the highways by either sponsoring clean-up events or hiring Caltrans approved maintenance vendors to perform the work on their behalf. Adoptions typically span over two-mile sections with permits issued for up to three-year periods.
VTA is working with its member agency local jurisdictions to sponsor all adoptable highway segments by their respective communities. The sponsorship includes an AAH sign with the sponsor logo or name displayed along the adopted segment.
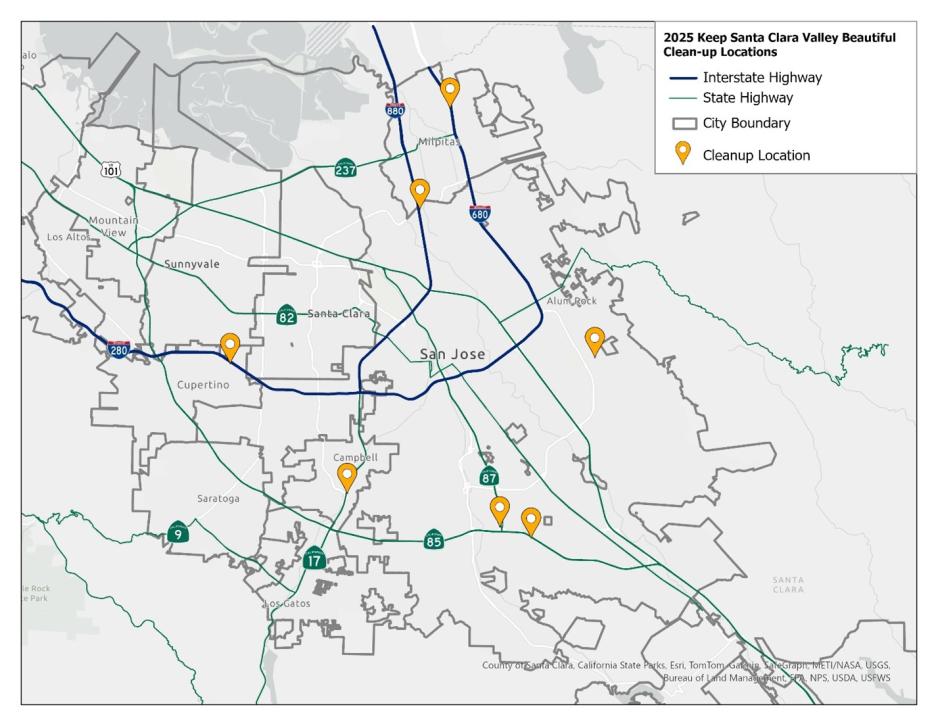
Figure 7. Keep Santa Clara Valley Beautiful Cleanup Locations, 2025
(View and download the data related to the map)

|
Zero Litter Initiative (ZLI) – ZLI is a voluntary group comprised of cities, water agencies, and conservation organizations including VTA, dedicated to developing and implementing anti-litter programs that focusses on preventing pollution from entering waterways leading to the San Francisco Bay.
Local Volunteer Groups – Other volunteer groups like City of San Jose’s BeautifySJ, Cupertino’s Keep Cupertino Community Clean, Gilroy’s Love Gilroy, and Saratoga’s Sustainable Saratoga programs are all working together towards a litter free county.

Acronyms:
AAH: Adopt-A-Highway
Caltrans: California Department of Transportation
CHP: California Highway Patrol
SY: Square Yard
VTA: Santa Clara Valley Transportation Authority
ZLI: Zero Litter Initiative
Sources:
The 2025 TSMP Litter, Illegal Encampments, and Graffiti Maintenance section focuses on quantitative data, representing the volume of litter and square footage of graffiti removed. The data was provided by Caltrans highway maintenance staff who record the amount of litter collected, square footage of graffiti removed, number of homeless encampments cleaned, etc. This information was also used to generate heat maps to visually show the amount and locations of these occurrences, and changes over time.
Keep Santa Clara Valley Beautiful – Information collected from the cleanup events were obtained from project staff.
Background
VTA Technical Advisory Committee identified highway litter, landscape, and graffiti maintenance as major roadway maintenance issues. The accumulation of litter and graffiti are viewed as driver distractions and potential hazards, as well as having negative impacts on the environment. The cleanliness of the highways can also be perceived as a quality-of-life indicator representing the level of community civic pride to residents, regional travelers, and tourists.
Inventory
There are approximately 307 roadside miles (shoulder length miles), 128 interchanges, and 1,193 acres of landscaped area on the State’s highway system in Santa Clara County requiring regular maintenance.
Conditions
Monitoring litter and graffiti on roadways is a challenging task, as conditions are constantly changing throughout the year, and any single day “snapshot” would not be an accurate data source. Prior to 2019, a subjective drive-by approach using a visual assessment scale was used as a performance metric to assess littler and graffiti conditions. This methodology was changed to a new data source and performance metric provided by Caltrans to cubic yards of litter collected and square feet of graffiti removed. Caltrans maintenance crews now keep records of their maintenance work including an estimated amount of litter, graffiti, and illegal encampments removed by freeway segment locations. This data has been translated into visual graphs, tables, and heat maps.
Litter
In FY 2025, an estimated 39,415 cubic yards of litter were picked up along the 307 highway shoulder miles in Santa Clara County. To provide some visual perspective, this equates to approximately 275,905 trash bags (1 cubic yard = 7 of 30-gallon sized trash bags) or approximately 23 football fields (300 ft. length x 160 ft. width).
|
|
Figure 1. 5-Year Total Litter Collection Trend
Compared to FY 2024, the amount of litter picked up increased by approximately 74% or 16,757 cubic yards (118,000 30-gallon trash bags). The reduction of litter on the roadways reduces distractions and risk of collisions.
The heatmap below depicts the locations and amount of litter collected in FY 2025. Caltrans maintenance crews typically clean each highway corridor two times a month throughout the year. The dark orange-reddish spots represent the areas with the most amounts of litter. The table shows the changes in amount of litter collected over a 5-year period by corridor routes.
Figure 2. Hotspot Map of Litter in Cubic Yards Picked up along Highways in Santa Clara County, FY 2025
(View and download the data related to the map)
Illegal Encampments
In addition to scheduled cleaning of the highway shoulders, Caltrans also recently started to record the location of illegal encampments and amount of litter collected at these sites. The encampment clean-up events require a 72-hour notice for the residents and are often repetitive. The data record shows that in FY 2025 an estimated 11,920 cubic yards of litter were removed from illegal encampments along the highways in Santa Clara County.
|
|
Figure 3. 5-Year Total Illegal Encampment Litter Collection Trend
Compared to FY 2024, the amount of litter picked up at illegal encampments during FY 2025 decreased by 4,306 cubic yards. The upward trend and improved conditions can be attributed to Caltrans Clean CA, CHP, and local agency increased efforts in past years to move the encampments off the highway system.
The heatmap in the Figure below shows the locations of the frequent illegal encampment locations along highways and amounts of litter collected at these sites. The data in the table also shows the amount of litter collected at the illegal encampments litter over a 5-year period by highway routes.
Figure 4. Hotspot Map of Illegal Encampments Litter in Cubic Yards Picked up along Highways in Santa Clara County, FY 2025
(View and download the data related to the map)
The locations with the most amount of litter collected can also indicate the size of the illegal encampments. For locations that are routinely occupied, preventive measures such as restrictive signs, fencing, installation of trash containers, and social service outreach can be implemented.
Graffiti
Graffiti and tagging on the highway system continues to be a problem in Santa Clara County. These incidents are typically seen on overcrossings, soundwalls, and signages. Caltrans maintenance crews and their contractors routinely patrol the highway corridors and either remove or paint over the graffiti. In FY 2025, an estimated 628,770 square feet of graffiti were removed along the highways in Santa Clara County. Compared to FY 2024, the amount of graffiti removed in FY 2025 decreased by approximately 50% or 617,605 square feet of graffiti.
|
|
Figure 5. 5-Year Total Graffiti Removal Trend
Caltrans graffiti removal efforts are conducted in partial segments of the highway, depending on the size and scale of the graffiti tags. The hotspot map below identifies the areas along highways with the largest number of square feet of graffiti removed. The data in the table also shows the changes in square footage of graffiti removed over a 5-year period by highway and freeway routes.
Figure 6. Surface Area of Graffiti per Mile Removed along Highways in Santa Clara County, FY 2025
(View and download the data related to the map)
The data collection for litter, illegal encampments, and graffiti could be improved if the amount cleaned could be reported in segments by post mile instead of corridors and by frequency.
SOLUTIONS
Keep Santa Clara Valley Beautiful is a countywide, multi-agency initiative to clean and prevent littering on the highways in Santa Clara County. Trash on the highways is hazardous to drivers, the environment, and residents. VTA is working together with several partners to develop a program to change people’s attitudes and behaviors towards throwing litter on the highways instead of in garbage cans or recycling containers.
The project includes organizing popup cleanup events in cities and towns throughout Santa Clara County, placing No Dumping enforcement signs at frequently littered locations, and forming local volunteer groups to help keep the community highways clean. In 2025, VTA, in partnership with Caltrans, Valley Water, CHP, and local jurisdictions, organized 7 volunteer cleanup events throughout the county, collected 310 30-gallon bags of trash, and rallied nearly 130 volunteers.
The map below shows the 2025 Keep Santa Clara Valley Beautiful cleanup locations along the highways in Santa Clara County.
Clean California - In July 2021, the State approved a $1.5 Billion 3-Year statewide transformation initiative to remove litter on the roadways, create jobs, and beautify California. VTA and local agencies in Santa Clara County are working with the Bay Area Local Caltrans District 4 Clean CA team to plan community volunteer clean-up events and free dump days in Santa Clara County. This program is scheduled to end in December 2026.
Adopt-A-Highway (AAH) – This is a Caltrans program that allows community volunteers and organizations to help maintain sections of the highways by either sponsoring clean-up events or hiring Caltrans approved maintenance vendors to perform the work on their behalf. Adoptions typically span over two-mile sections with permits issued for up to three-year periods.
VTA is working with its member agency local jurisdictions to sponsor all adoptable highway segments by their respective communities. The sponsorship includes an AAH sign with the sponsor logo or name displayed along the adopted segment.
Figure 7. Keep Santa Clara Valley Beautiful Cleanup Locations, 2025
(View and download the data related to the map)
|
|
Zero Litter Initiative (ZLI) – ZLI is a voluntary group comprised of cities, water agencies, and conservation organizations including VTA, dedicated to developing and implementing anti-litter programs that focusses on preventing pollution from entering waterways leading to the San Francisco Bay.
Local Volunteer Groups – Other volunteer groups like City of San Jose’s BeautifySJ, Cupertino’s Keep Cupertino Community Clean, Gilroy’s Love Gilroy, and Saratoga’s Sustainable Saratoga programs are all working together towards a litter free county.
Acronyms:
AAH: Adopt-A-Highway
Caltrans: California Department of Transportation
CHP: California Highway Patrol
SY: Square Yard
VTA: Santa Clara Valley Transportation Authority
ZLI: Zero Litter Initiative
Sources:
The 2025 TSMP Litter, Illegal Encampments, and Graffiti Maintenance section focuses on quantitative data, representing the volume of litter and square footage of graffiti removed. The data was provided by Caltrans highway maintenance staff who record the amount of litter collected, square footage of graffiti removed, number of homeless encampments cleaned, etc. This information was also used to generate heat maps to visually show the amount and locations of these occurrences, and changes over time.
Keep Santa Clara Valley Beautiful – Information collected from the cleanup events were obtained from project staff.